The big unanswered question, was last week’s late selloff in yen pairs a needed pullback or a reversal?

Weekly chart of USDJPY tells it all, I am staying long USD
The big unanswered question, was last week’s late selloff in yen pairs a needed pullback or a reversal?
Weekly chart of USDJPY tells it all, I am staying long USD
Just checking in to see how our 48 hour old analysis is running… REAL Time.
Saturday 11th June (Market Closed)
Monday 13th June (London 11am)
Enjoy…
Ugly day in stocks, new lows for all major indexes, in currencies US is still holding its own against the yen, and my favorite risk-off trade AUDUSD* had a big move


USD to number one spot as predicted 3 days ago and NZD 0.89, GBP 0.89 fast closing in on Number 7 & 8.
GBPUSD 300 Pips (Open
NZDUSD 130 Pips (Open)
GBPCHF 35 Pips (Open)
EURAUD 75 Pips (Closed)
And we didn’t even take the AUDUSD even though it was a cross opportunity.
500 Pips across 4 positions… All in the space of 48 open market hours…
Come on Guys… It really isn’t that hard…
I use a 7 year old graphics package called CorelDRAW… You can use any Vector based graphics application, Adobe Illustrator, Indesign. There are now dozens of apps that will give you the ability to overlay…
To be honest, traders proficient with graphic features within Microsoft Office apps such as Word, Excel or even Publisher will get the job done.
You just cut and paste Dennis’s updated SWA image and add it to the existing ones previously pasted and overlay some lines on a new layer…
Colour code and memorise your lines, so you can see at a glance what is crossing over…
|
|
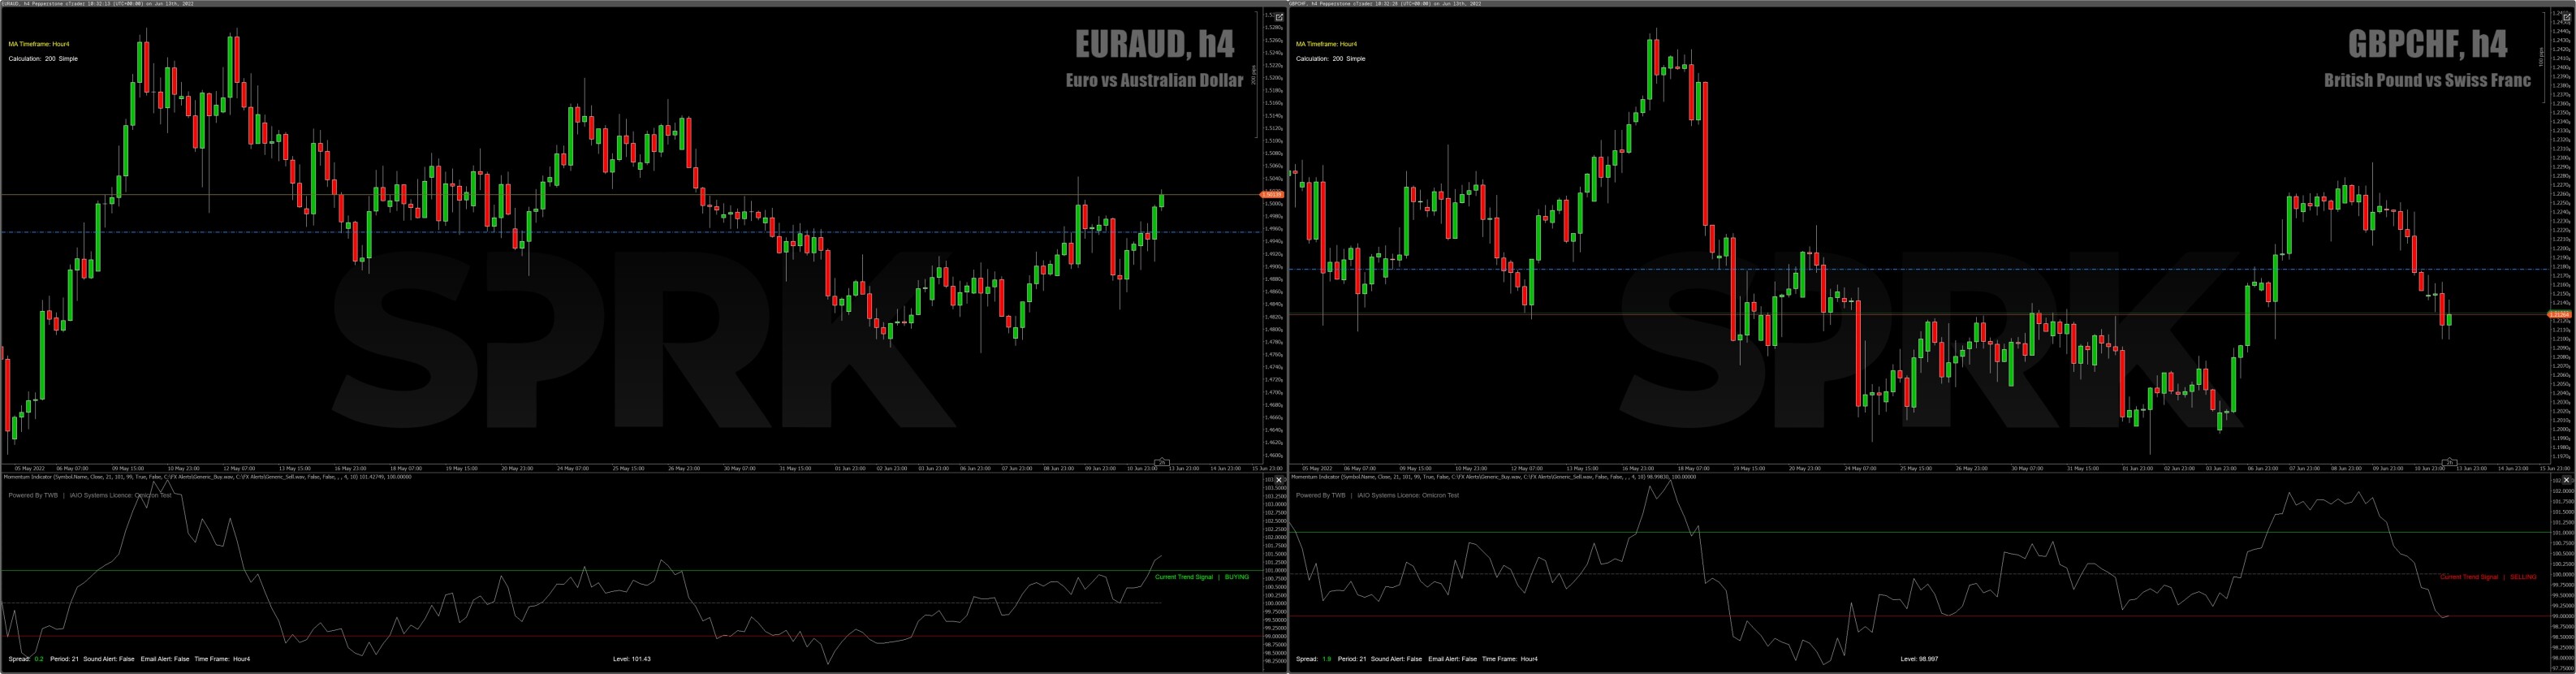
Why would we close out positions on EURAUD (7.00am UTC+10) and GBPCHF (11.00am UTC+10)?
Momentum crossed back below the Green line… No SL, alternative level risk management employed.
Result… 70 Pips.
GBPCHF has moved to a consolidation phase, it’s going nowhere… Momentum is crossing back above the Red line… No SL, alternative level risk management employed. We can always get back in again later if Momentum breaks back below the Red line. Result… 15 Pips.
Notes: Something else to think about when using Dennis’s SWA Strategy… Certain Currencies are stronger than others… I’ll break them down into two groups…
Group 1 comprises USD, GBP, EUR, JPY (Strong(er))
Group 2 comprises CAD, AUD, CHF, NZD (Weak(er))
For example the USD crossing above say the NZD , the USD’s strength (Percentage) will move price more than NZD’s… ie: If USD is say 0.5% stronger than the NZD, price will move further than if say NZD was 0.5% stronger than USD… Similar theory applies to most of the 28 pairs that make up the SWA Strategy.
We have just seen this with the CHF struggling to pull the GBP down, likewise with the AUD against the EUR… And the opposite with a strong(er) USD against the weak(er) AUD and the NZD.
Using Dennis data, you can back test this with your charts by comparing trends and percentages of various pairs… Back Test… Back Test… Back Test…
Anyway, this should be enough for now… Back to you Dennis…
A gem right there, I completely agree. Helps with filtering trades for more pips! Thanks
I like the way you trade. Although, I don’t trade in this pair. I prefer trading EUR/USD the most.

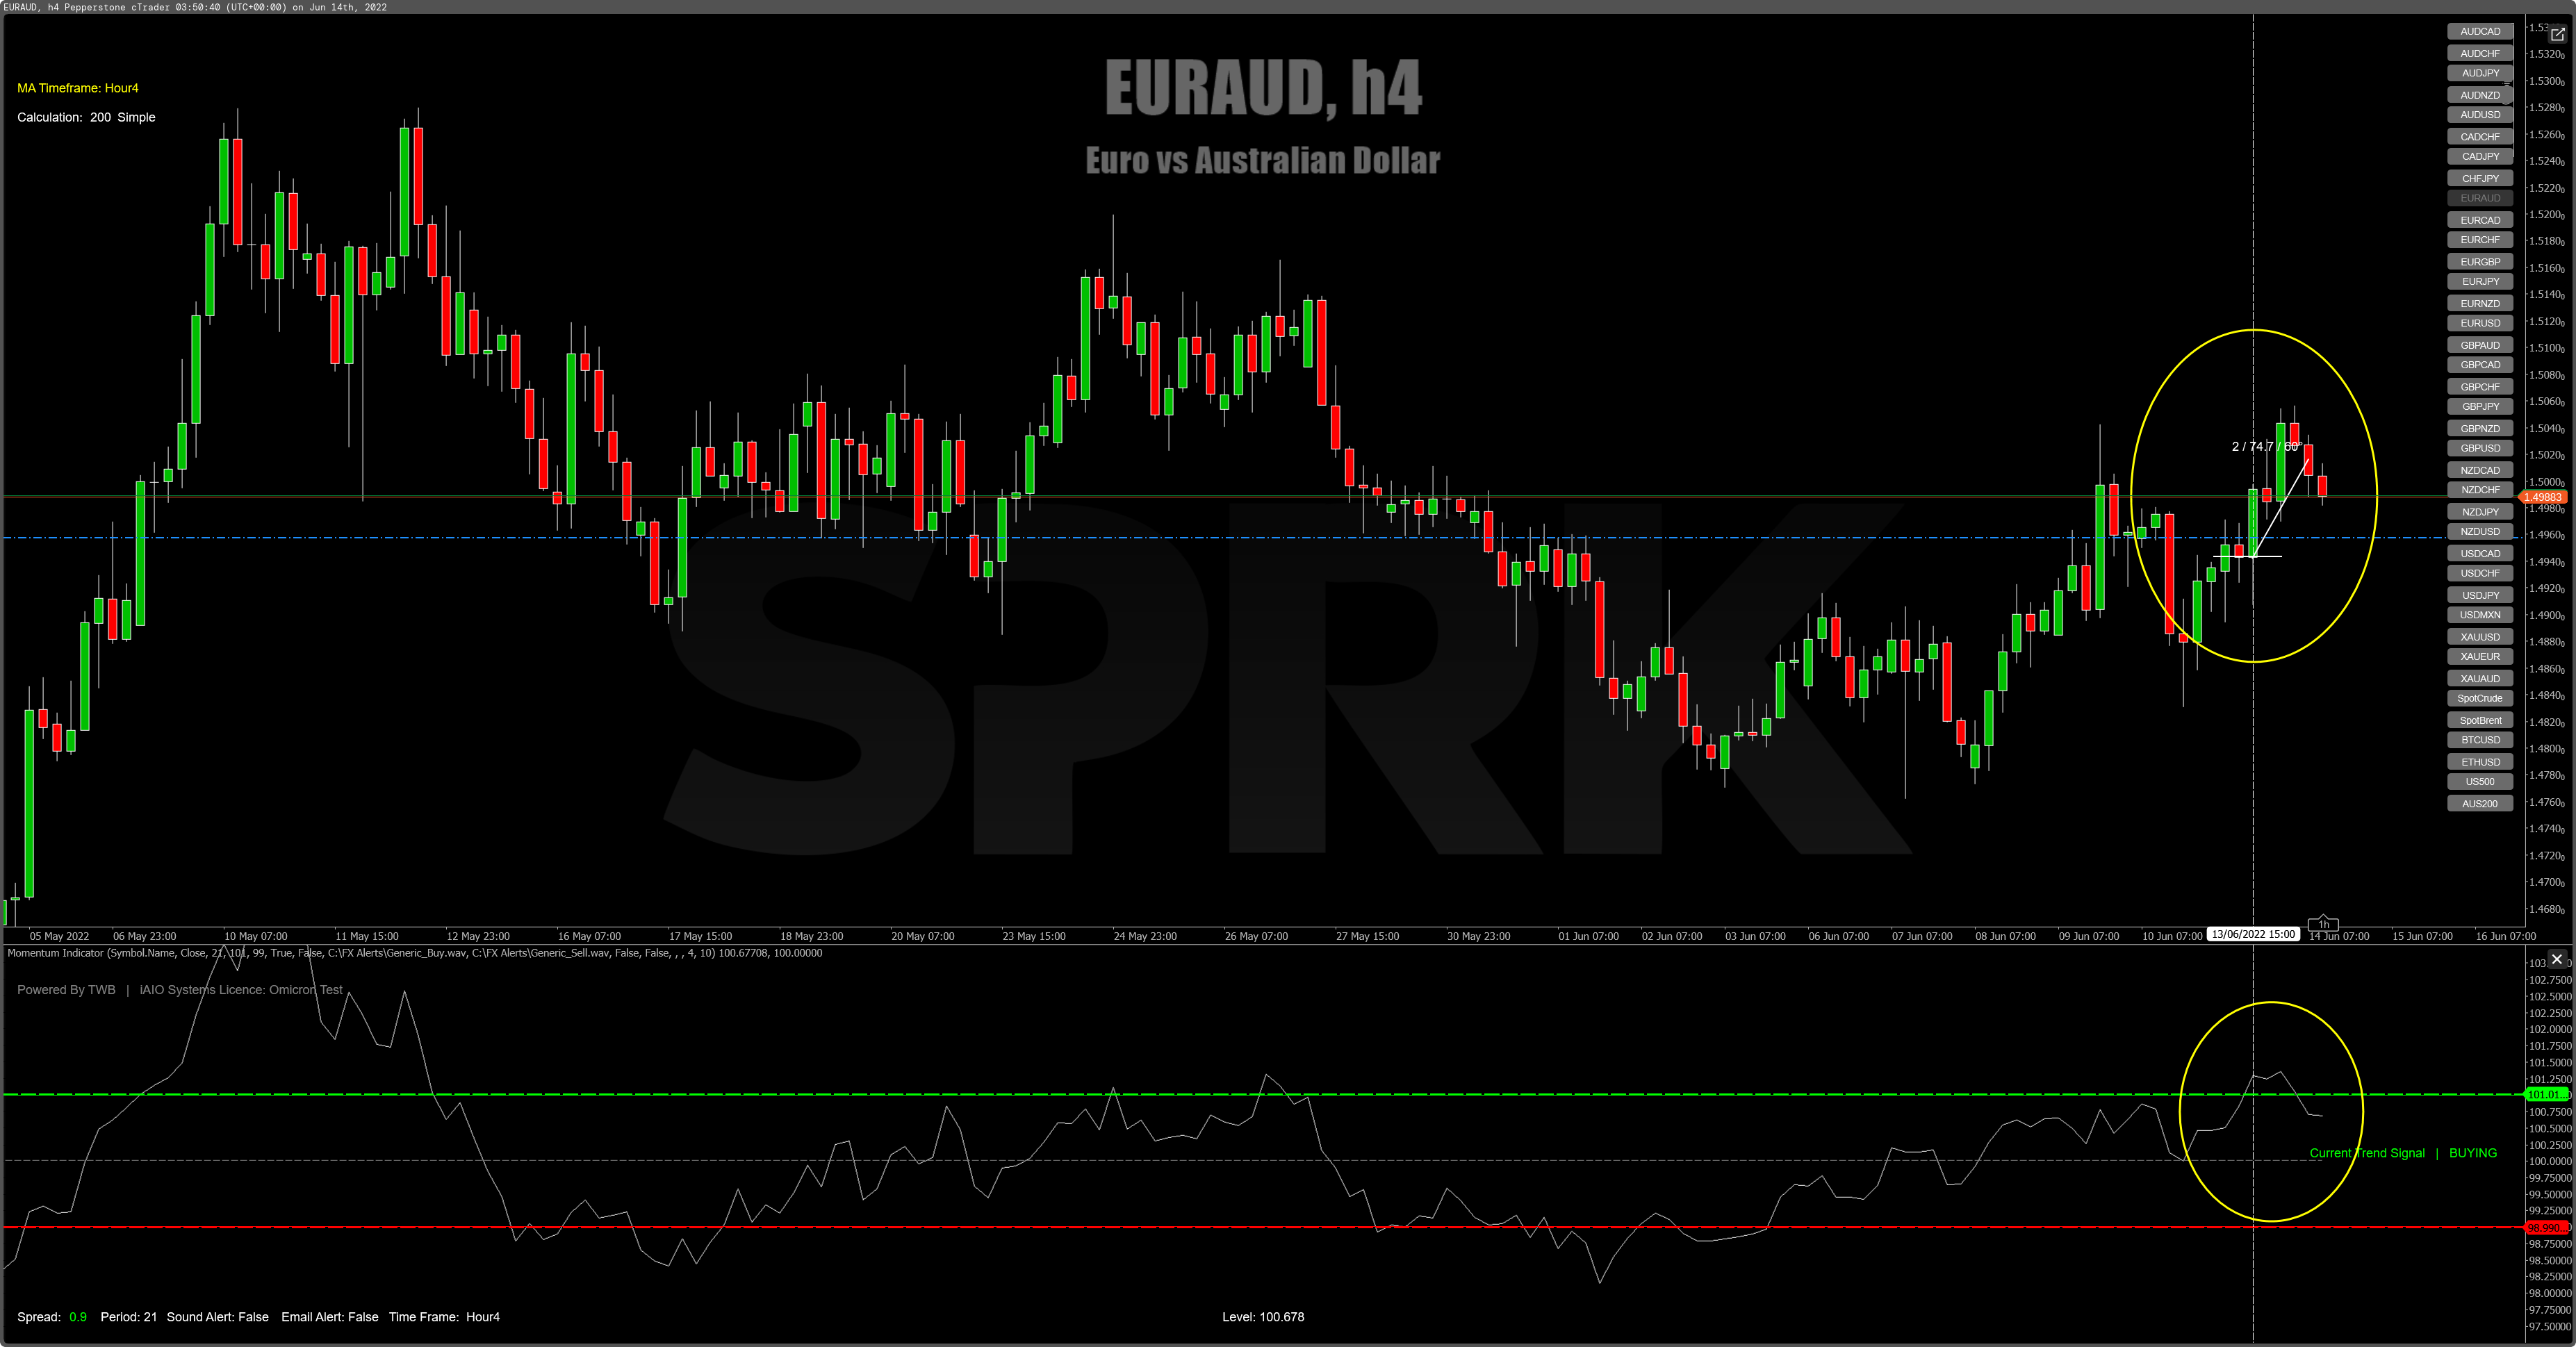
Just following up from earlier in the week…
We can see today how the USDJPY (JPY has strengthened) has declined as soon as it hit the top trade… Nothing against Dennis’s SWA Strategy… This happens from time to time… But you can see it coming…
If you have applied the Momentum Oscillator as I layout earlier this week, you would have had plenty of warning the trend momentum was weakening and would/should have been out of your position (2 points) before the huge reversal at the London Open on Thursday morning…
All part of an alternative risk strategy to relying on a Stop Loss…
I know… Shock, Horror right…
I also coded into the Momentum Indicator a Real Time SWA Percentage Value field (Bottom of Chart), so I don’t have to do the calculations in Excel anymore…
Just take the values and shuffle the order at the New York close.
Great stuff man, thanks for always being incisive, giving freely and positively. I use the COT report as additional confirmation. So commercials had already started unwinding CAD, EUR, CHF, GBP and JPY shorts a week ago. Economic data like the Interest rate decisions across all major economies serve as the final puzzle. I have realized trading when technical analysis and fundamentals are in alignment is a sure fire way of making some serious money.

Note the leap of CHF to the top with astronomical daily moves of 300% plus and for the CADCHF +428% of the ADR(10)

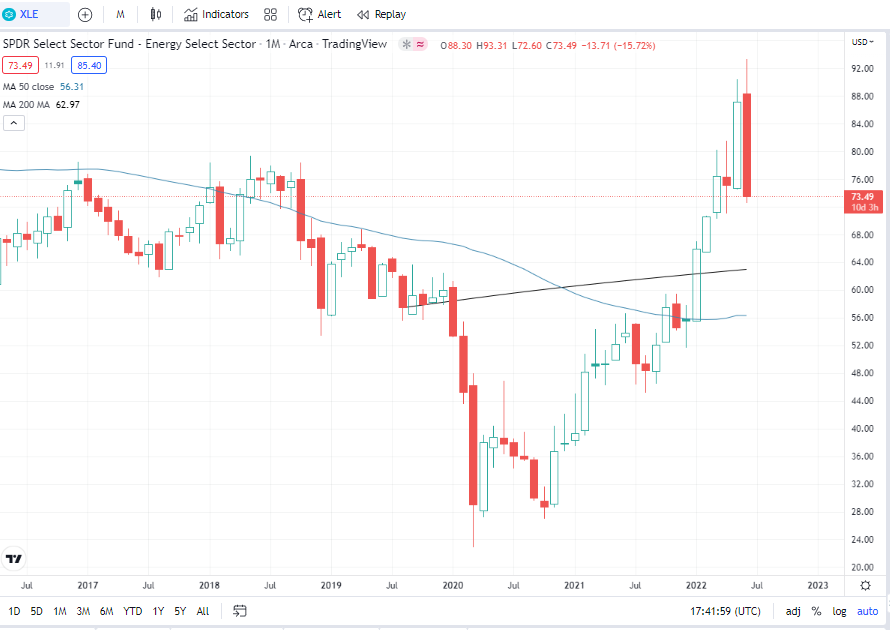
No where to hide, energy, this year’s safe haven is now looking at its biggest one-month drop since March 2020
US markets closed today, no change in rank order

Mostly green day, stocks are in a mild rally, Strong Weak top trades USDJPY, CADJPY and CHFJPY are killing it again

our yen trades just keep going, if you are not making money in this market then you will never make money trading FOREX