A new week and everything is red, Bitcoin continues to get hammered. Classic risk off-market
There will be dips but I look for Yen to continue to gain strength and US dollar to remain strong

A new week and everything is red, Bitcoin continues to get hammered. Classic risk off-market
There will be dips but I look for Yen to continue to gain strength and US dollar to remain strong
Markets recovered a bit in afternoon trading to finish mixed


Could this be a real rally and not another beartrap
Note; I pulled my numbers at 6:45 and will include the first 1:45 of the new trading day, but markets have only moved a few pips for it should not matter


These movements do provide great intraday opportunities, especially on the indexes.
Also, on currencies with s/w exodus, but the indexes are more reliable.
I
Yesterday I posted
And today we got our answer

I pulled these numbers a little early, another huge market selloff, Years of 401K savings were wiped out in a single day. And as our retirement savings are being wiped out, the cost of everything has doubled
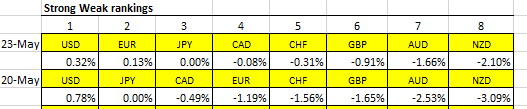
On the positive side, Strong Weak is still putting us in winning trades

You only lose if you sell. Not talking about forex of course.
Some interesting info:
Over the last 92 years, bear markets have accounted for 20.6 of those years. (Stocks have been on the rise 78% of the time.)
The gains during bull markets far outweigh the losses of bear markets.
Statistically, stocks lose an average of 36% in a bear market and gain an average of 114% in a bull market.
Historically, the (stock) market has rewarded investors who stay calm and carry on.
That is not helpful if you are 72+ and face “Required Minimum Distribution”
While this is true, every financial advisor will tell you " Past performance is no garentee of future results"
We might have a new number one tomorrow

I already have a new number one.
But selling NZDJPY doesn’t look promising.
Price above 200 MA on daily, moving away from monthly fib pivots towards monthly pivot.
Also my SW indicator based on movement on all pairs over the last 34 days is ambigious and does not compare well with the SW rankings.
Of course my lines start at zero while your rankings don’t, as shown below for the 4 April:
I use a similar Indicator and my result is exactly the same to the one you have displayed above.
The 34 day formula works (34 days x 24 hours = 812 hours / 4 = 204 Periods)
Some of these SW Indicators use a different currency weight (strength) calculation for each of the currencies, some use a formula based off all 28 pairs values like yours, while others use a ROC (Rate of Change) or Momentum formulas to display each currency’s output.
The other slight deviance that is caused by the Indicator strategy… Dennis takes his input from the last hour before or after the US Market closes… The Indicator takes an input every 4 hours (1 Period).
BTW, great data display from the Indicator. Hope this is of help.
Do you know how this is calculated in MarketMilk? It doesn’t seem right.

Markets are consolidating
No surprise here, Yen takes over #1

A mostly green day


Both new Top Trades NZDJPY* and AUDJPY* shorts are in short-term uptrends. Does this countertrend move nullify the signal, I would say no, but every signal is a whole new trade and pays little attention to past trades
These are difficult times to find a long-term trade, which will last long enough and move far enough to justify the decision to take a trade.
Of the 28 main pairs, I have 17 showing Avoid as they are not moving in consistent trends. 4 of the remaining 11 show counter-trend outside reversal bars and 6 more show weekly bar overlaps of 5 or more weeks.
Not worth the effort of looking for entry points right now.
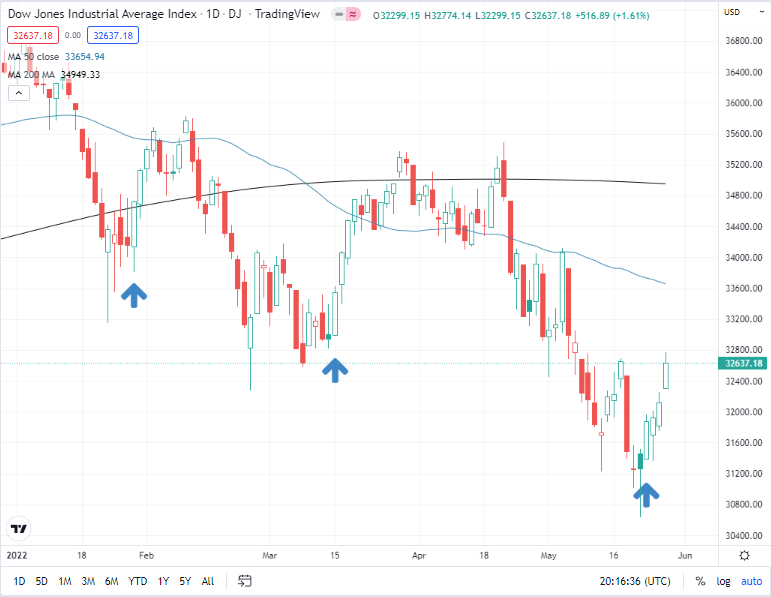
Looking at the DOW 30, for just the third time this year, we have had 4 hollow green candles in a row ( this candle indicates a close higher than the open). The previous two were preceded by another deep sell-off and a lower low. Will we break the pattern this time or are we headed for more selling and yet another lower low