Trading the Trend with Strong Weak Analysis

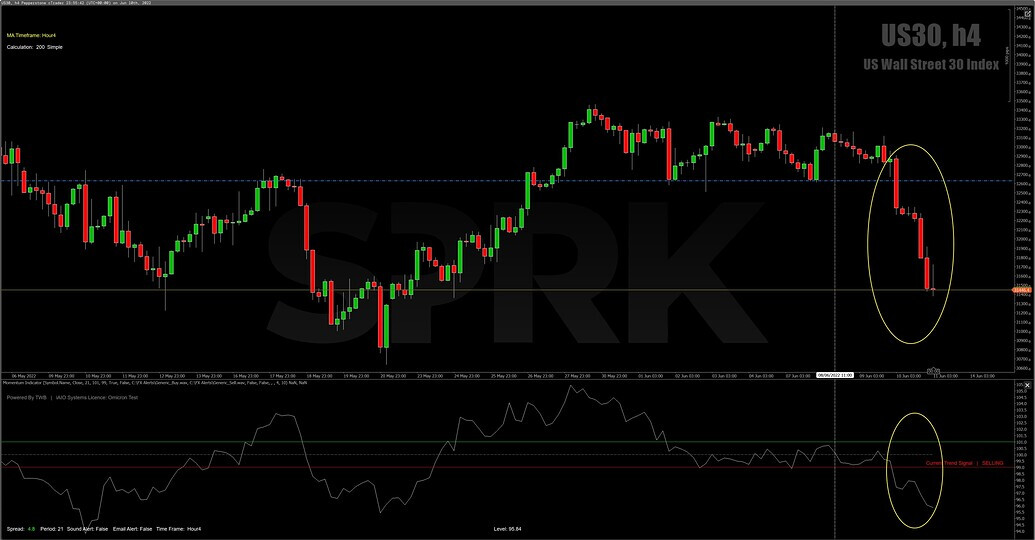
Exactly @FOK, it is to remove the guess work of were a pair is likely to go next… A perfect proof of concept was the US30 Chart I posted 24 hours ago…

Compare the two Chartshots… A slam dunk of a move or a shear fluke??

No… I didn’t trade it… I was busy elsewhere.

Dennis, I have spent a few years in this thread trying to expand and improve your SWA concept so old and new members can fully utilize this strategy, and from the patronizing response I just received shows once again I am just wasting my time in this forum…

You may remember a few years back when I posted the concept of trading within the SWA Matrix. So traders could get into a move early, reducing one of the risks with this strategy of opening a position when the Strong and Weakest momentum is over… (See Here from Feb 2019)

You can follow down the thread to see how this was applied in real time…

This encouraged me to start mapping your Matrix, which I did for 12 months or so to show traders the ebb and flow of the currencies within this strategy… Being able to visualize how this works was a game changer for many… (See Here from Oct 2020)

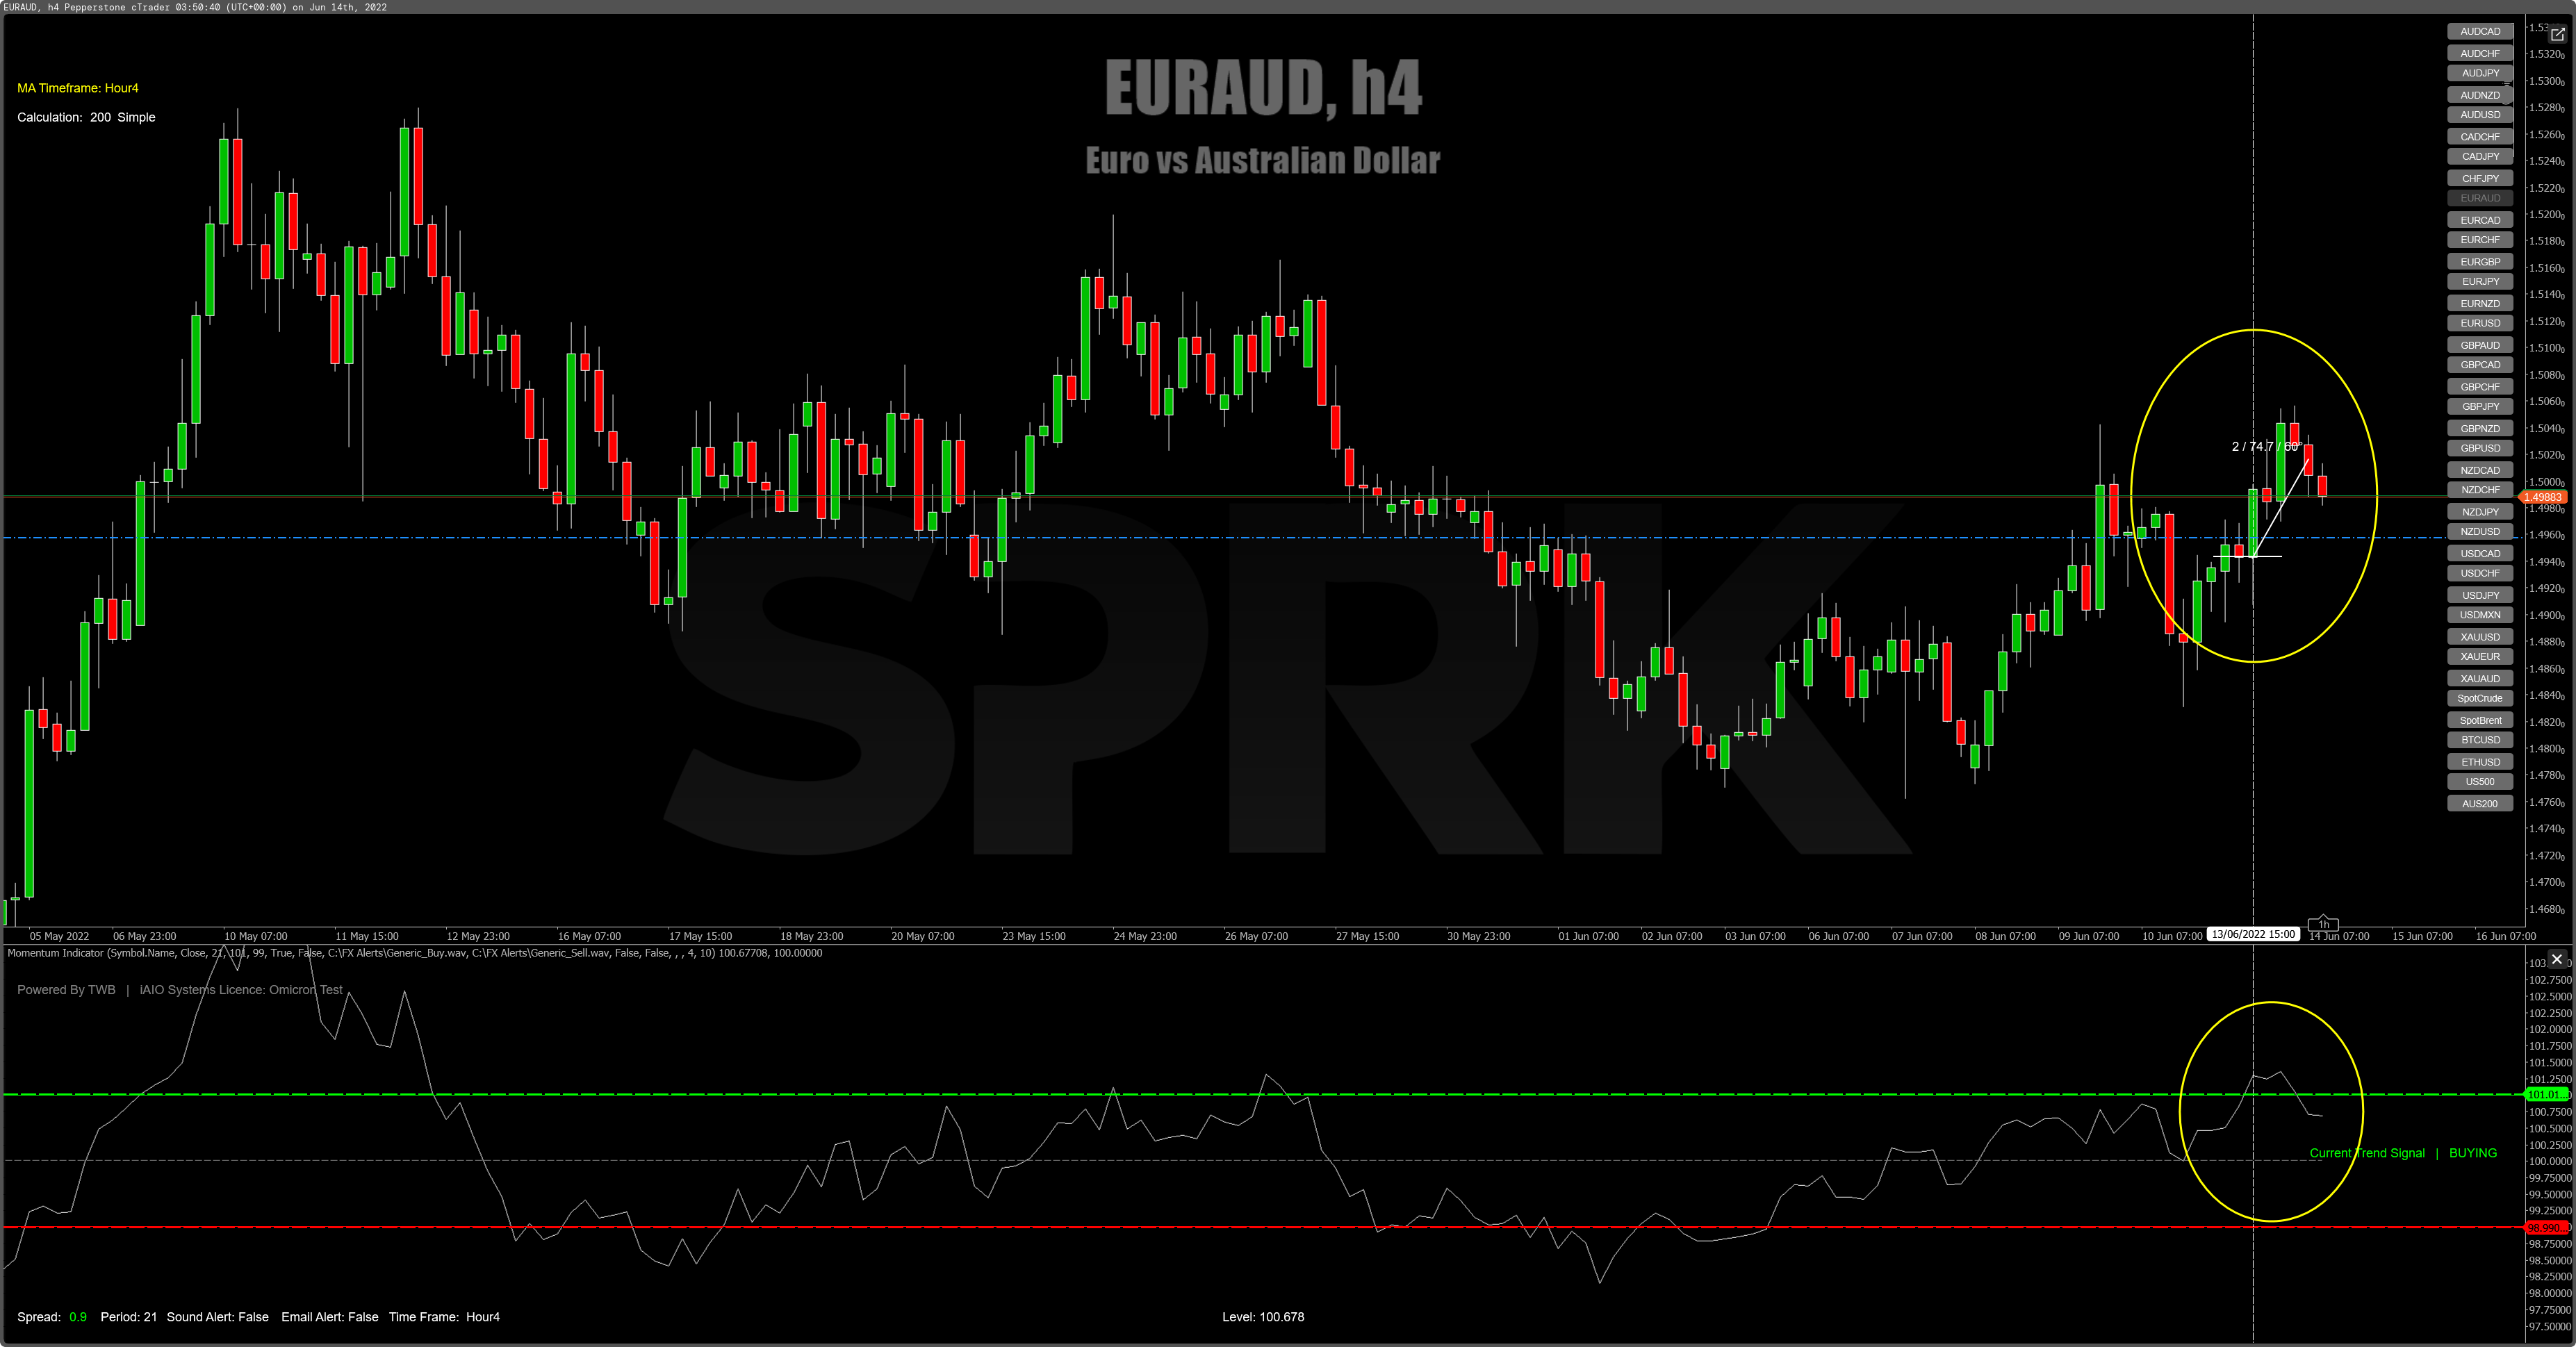
All I have displayed in the latest installment is a way to gauge how strong the momentum is for each and every permutation that your SWA Strategy signals as a possible opportunity… That’s it!!!

There seems to be a religious fervor in these forums…My System or Nothing… which is a really sad, sad state of affairs. It crushes any open, critical and constructive discussion of what is posted.

If any of you have the time… Read back through my profile… I never EVER discourage members from proposing new risk management or trading ideas… I attempt to post concepts designed to make traders think about concepts outside the blinkered Forex educated box… To discard this Religious close mindedness…

There is 1000’s of ways to Skin this Cat (Sorry, Cat lovers…)

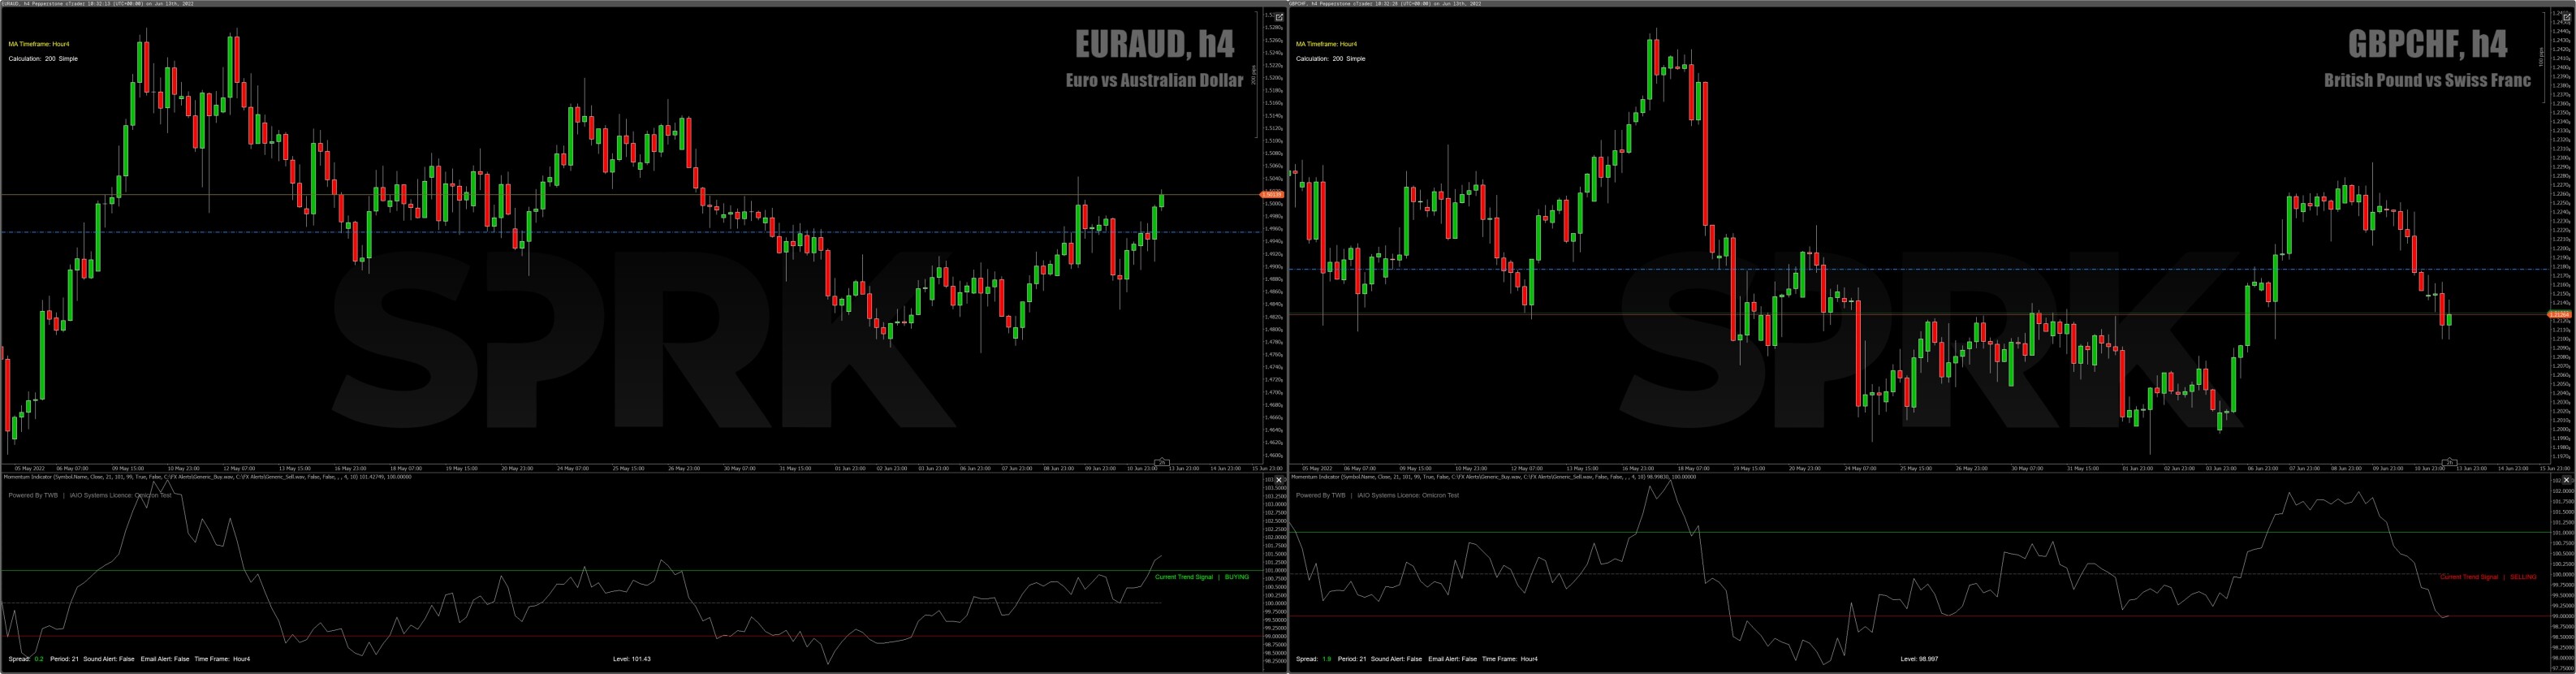
Although not showing in the SWA Matrix yet… These currencies are on the move…

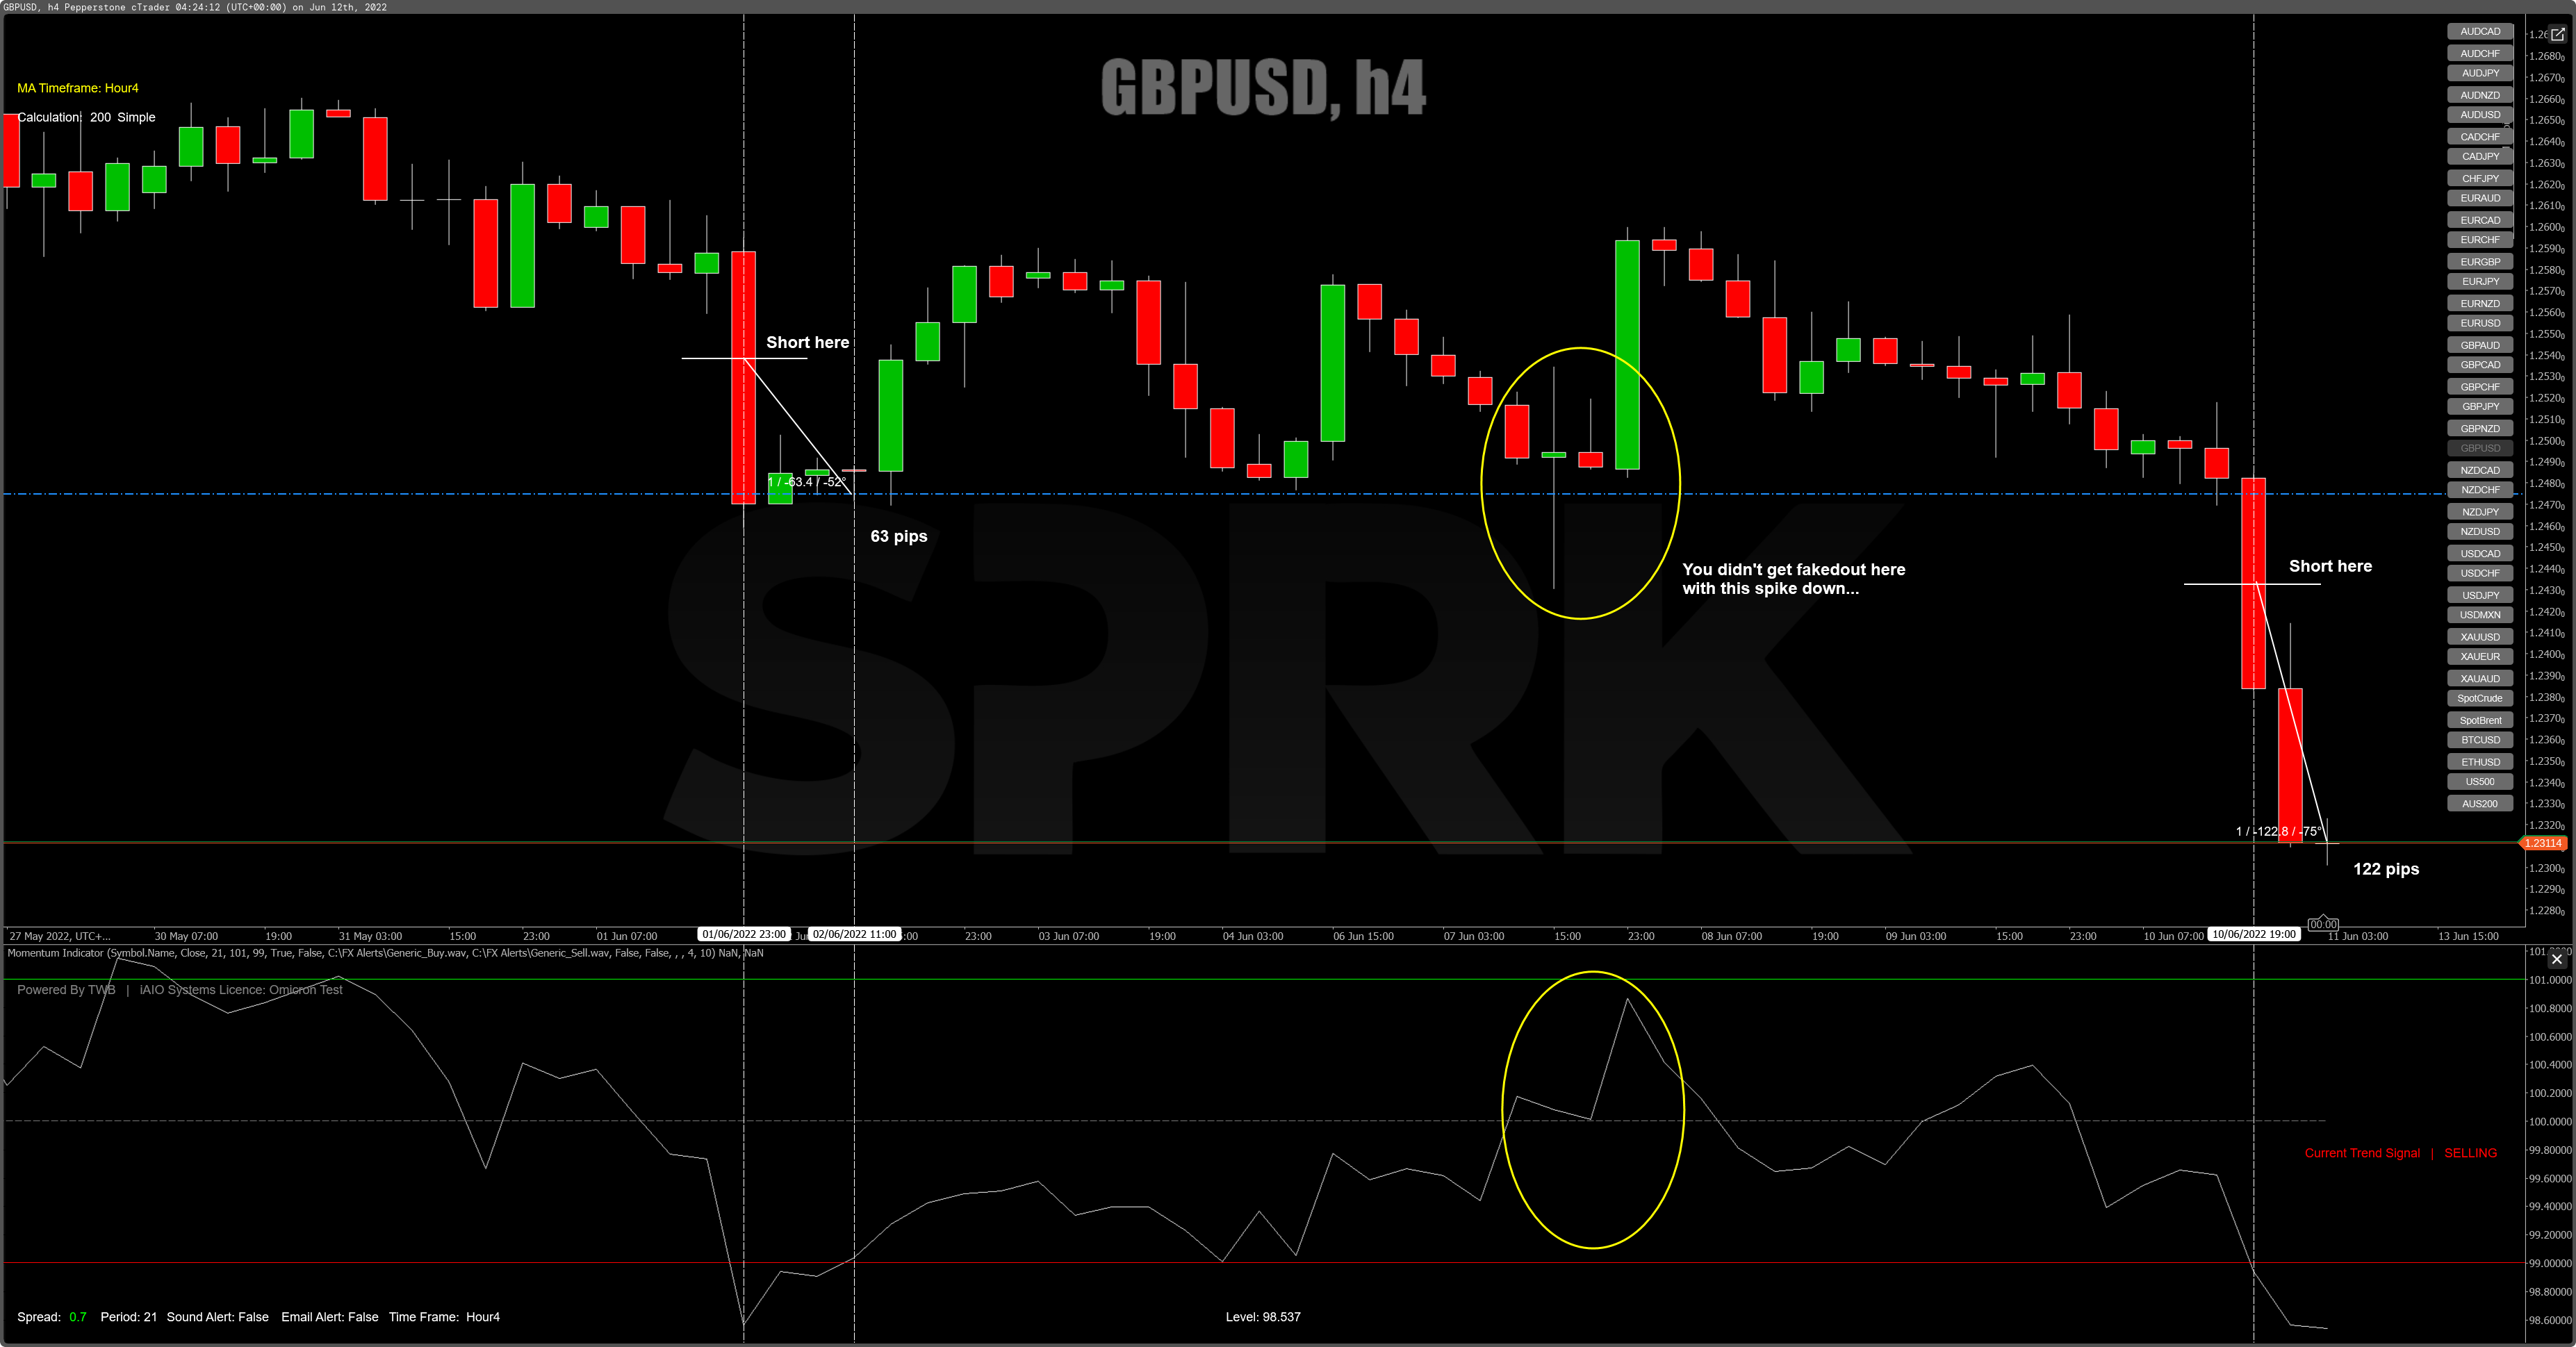
NZD and GBP are headed for 8 with US on it’s way to 1… There, I put my money were my mouth is!!

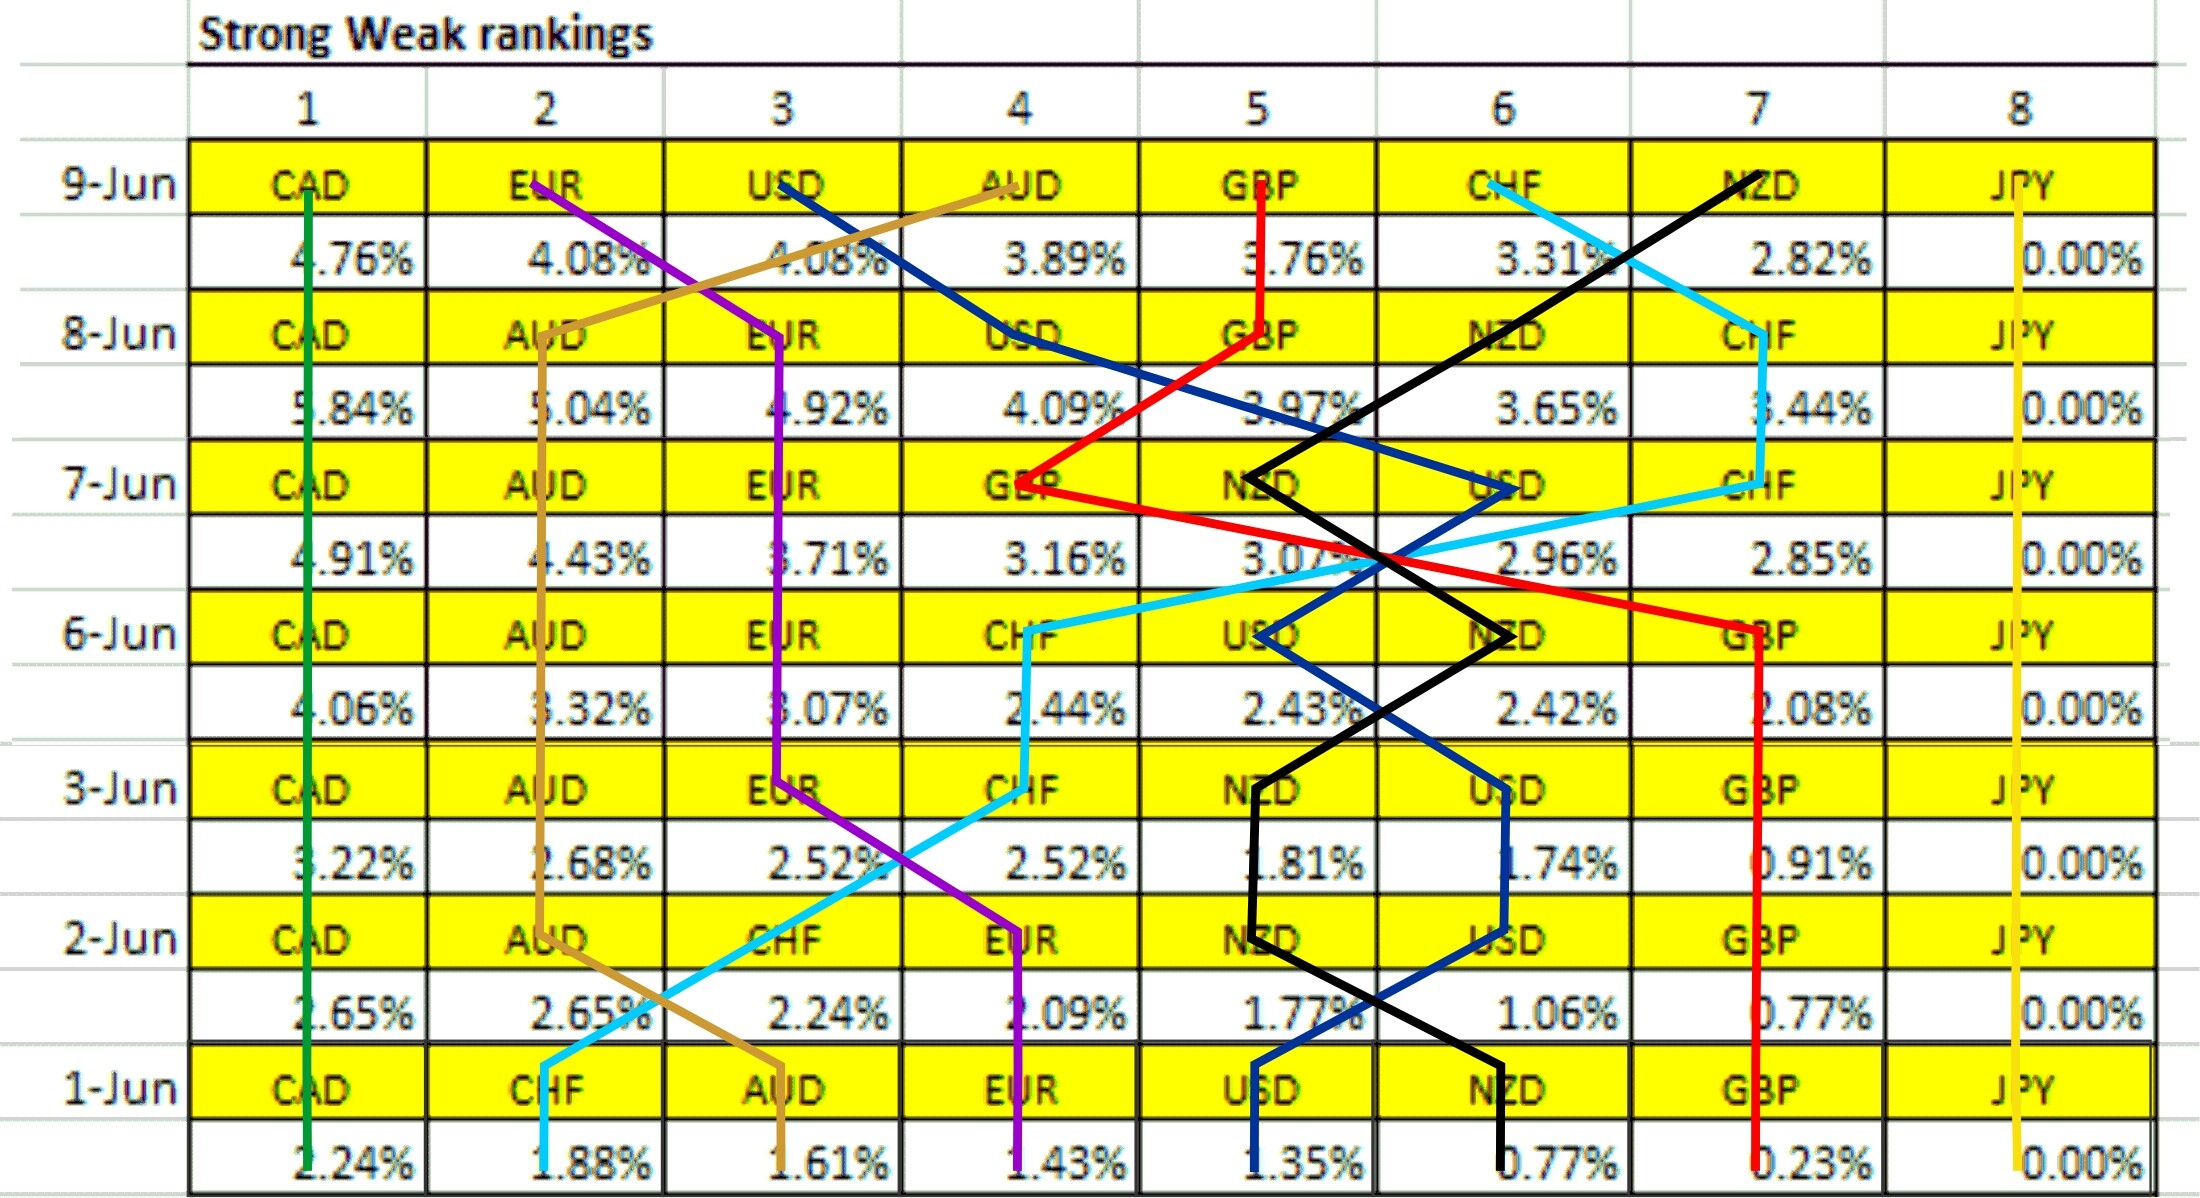
Check your charts where the USD crossed above the GBP and the NZD on the 8th, the EUR crossed above the CHF on the 3rd… the AUD above the CHF on the 2nd…

How many others here are prepared to show the Courage of their Convictions…?

8 Likes

I don’t think Dennis is being patronising. When I looked at the chart that you’re saying it’s simple to see the top from the indicator, I had absolutely no idea what is so obvious from it. In the uptrend that we’ve just had, the momentum indicator changes direction maybe 10 times. Picking the one that was at 107 is what we want, I have no idea how you’d do that in real time from that chart and indicator.

If you can go through that chart bar by bar and pick the top without seeing the candlestick formation afterwards, then you’re seeing something that I’m not.

Not read your other thread yet, but watching the movement of the currencies in the matrix is something I’ve found useful too.

Edit, this isn’t me being patronising or saying you’re wrong. What I’m saying is, it isn’t obvious to me. And that’s kind of the point, if trading was easy then everybody would be millionaires. Annoyingly, I had my TP set pretty much exactly where price reversed, but I thought the move was so strong that it’d keep going and moved it further out. Probably cost me 10-15% of what I would have made if I left it there.

2 Likes

@chesterjohn, You have Absolutely no idea… Really? So looking at the Mom Indicator and it’s application on the Dow (US30)…

It’s history and price action behavior, do you think you would be inclined to go Long…?

Even hold an existing Long position open?

This should be interesting…

Fantastic… I’m not the only one to post about this in this thread… Can you link your posts to this concept, we can compare ideas…

2 Likes

Not at all, what I’m saying is that the CADJPY image you said it was easy to spot the top with that indicator. I’m saying that I can’t see anything different on that indicator at the very top to what it did in the previous 4 or 5 times when the move slowed for a few candles. If I was using that indicator, I’d have been out much earlier or in and out rather than holding until the ultimate top. Maybe that’s ok, but it would have been lost pips in the process.

Of course that indicator works, they all do if used correctly. The question was about identifying the top or bottom of a move to get the maximum value out of a trade. I don’t think anybody on here has demonstrated a reliable way to exit at the “best” moment.

I don’t document anything that I do, I’m not an organised person. Having since read your thread, it’s very similar. I look for currencies that show big daily changes and prefer to enter if that change is in the same direction as a longer term trend. That’s probably been one of the most reliable methods I’ve used along with stochastic on the weekly chart before covid shook the markets up.

1 Like

OK… The Tops and Bottoms comment above has been taken as literal… Should have known better in these forums…

If any of the fore mentioned Indicators cross the 50/100/Center level, it’s time to exit or an opportunity to enter… These Indicators are not going to be crossing from Weak to Strong or Vise Versa if a Top or a Bottom is still in play… Are they?

Neither can I… I never stated I could see the exact Tops and the exact Bottoms… That was Dennis’s accusation… It’s to display whether you should be looking to exit or looking to enter… Simple…

But using your analogy of how this Indicator works… We would have been into the CADJPY on May 30th and closed the position on June 9th… Approx 53 candles for a 590 pip profit… Check your chart.

I’m shocked… That you have never tried to help some of the newer posters in this thread by adding to the trading within the Matrix conversation…

2 Likes

Accusation, what accusation? If you have something that can enhance Strong Weak then I want to see it in action, below is the CADJPY, we had 11 green candles in a row before the two down candles to end the week and maybe signal a short-term top. All I am asking is on what day did you see it was time to get out or tighten up your stops. I would just like to see this in real-time, not after the fact.

I am a skeptic of oversold/overbought indicators, I have used them, traded with them, and have discarded them in favor of pure price action, momentum, and trend. that is just me

1a

1 Like

On the 11th day of the CADJPY run, I posted this

It turned out I was right, no indicator just experience that told me it was time to lock in some profits

Edit: Using this strategy I would have been managing CADJPY from 10am on 9th of June (your TZ) and would have Closed down the position ~ 10 - 11pm later that day (your TZ - 12pm June 10th my TZ)…

The Filters… A cross up and over is a Buy. A cross back below the green line is a Close… Same for the example below… A cross below the Red line is a Sell, a cross back above the Red line is a Close… A cross over the centre gets it on a watch a list… Bouncing along in between the Red and the Green is accumulation… Not a trading opportunity…

It’s not being used for reversals… As an oversold, undersold Indicator like you think it was… It’s modified to display momentum… Strength and Weakness of a trend.

I’m not going to argue with you Dennis… After all it is your thread and a meticulously maintained and valuable thread at that!

I trade Tuesday thru Thursday… Full Time… I cannot make a living waiting around for positions 1 and 8 to develop… I developed a strategy to trade within your Matrix a few years back and showed how successful it can be Real Time… I demonstrated many example of Real Time results in this very thread.

Once again, (See Here)

Not many in here have the guts to call the ball and follow through with results.

And I agree with you… Indicators can definitely add to the confusion of price action. Both of the threads that I maintained for a while… Newbies, Stop being befuddled by Charts and Currency Strength and Weakness without Indicators confirmed that less can be more when trading these markets.

You overlooked this example… In the original post, I displayed this in Real Time, with the second screenshot posted 24 hours after the first… It doesn’t get more Real Time than this in this forum…

Not all traders here are experienced… Not all can call the beginning or end of a trend… Not all can visualise the ebb and flow of the eight majors in the markets… So, I have displayed an alternative way to measure and visually confirm the strength (Not Percentages) of the currencies against each…

I’ll monitor the crosses in next weeks market and provide another Real Time demonstration of how to apply a momentum /volume/ROC strategy to display the strength or weakness in a particular move.

3 Likes

TWB,

as I understand it, you would sell GBPUSD, based on the above.

The biggest drop is in GBP (from 3.8 to 2.2 =-1.6), the smallest drop in USD (from 3.7 to 3.5=-0.2).

If you look at the chart:

You would have a similar problem you highlighted with Dennis’ SW analysis, that a big drop has just happened. Admittedly with some more room to move to a recent low.

You said you don’t trade on Monday and Friday, is that because you don’t trust the daily candles on those days maybe?

2 Likes

Hi @ikdenk, Yes the GBPUSD would have been Short 3 candles ago on the 4h TF.

An analysis of applying this strategy on the GBPUSD 4 hour Chart is shown above… You would be around 100-120 pips in profit from the cross over of the Red line a few hours after the London open on Friday… (7pm my TZ)

Now we can use 4 concepts to speculate what happens next…

SWA Mid Currency Strategy… The percentage gap has been decreasing and the GBP has now crossed below the USD indicating that this pair’s sentiment has become a SELL.

Price Action Strategy… Price is below the MA200, and could possibly move down to the level already tested…As you suggested. It will either break further down or it could reverse off this level (check back through your chart for precedents).

Momentum Strategy… The falling price has caused the Indicator to cross below the Red line… More confirmation that this pair is going to continue downward…

Experience… The Markets will open on Monday and possibly trade into the Selling pressure of this pair, due to the low volumes traded Mondays during the Asian Session, this could drive the price up…

Confused…?

If you had opened a position as indicated on the screenshot you currently have a reasonable profit, you are now managing the position… If the GBPUSD bounces off this level you close the position content with 100 pips or you wait to see if the Indicator moves back above the Red line and close out there.

Now, every time there is a currency cross in your SWA Matrix, you can apply the above to help you make a decision on where price is likely to go.

I’m in the Asian zone (Australia), trading Monday’s is a waste of time as markets don’t really move until 5-6pm (London Open)… And Friday’s I just manage positions that I have open… I only want to be committed to this 3 days a week… I have other pursuits.

I hope this is some help.

3 Likes

The big unanswered question, was last week’s late selloff in yen pairs a needed pullback or a reversal?

1a

Weekly chart of USDJPY tells it all, I am staying long USD

5 Likes

Just checking in to see how our 48 hour old analysis is running… REAL Time.

Saturday 11th June (Market Closed)

Monday 13th June (London 11am)


|
|
24 Hour opportunities… the EURAUD for a BUY, GBPCHF for a SELL… EURUSD… Just watch…
Notes: Wait for another 4 hour candle from the GBPCHF and EURUSD.

Enjoy…

3 Likes

Ugly day in stocks, new lows for all major indexes, in currencies US is still holding its own against the yen, and my favorite risk-off trade AUDUSD* had a big move

1a

1a2

2 Likes

USD to number one spot as predicted 3 days ago and NZD 0.89, GBP 0.89 fast closing in on Number 7 & 8.

GBPUSD 300 Pips (Open

NZDUSD 130 Pips (Open)

GBPCHF 35 Pips (Open)

EURAUD 75 Pips (Closed)

And we didn’t even take the AUDUSD even though it was a cross opportunity.

500 Pips across 4 positions… All in the space of 48 open market hours…

Come on Guys… It really isn’t that hard…

7 Likes

@twb12

What program do you use to draw the lines on the SW spreadsheet, please?

I use a 7 year old graphics package called CorelDRAW… You can use any Vector based graphics application, Adobe Illustrator, Indesign. There are now dozens of apps that will give you the ability to overlay

To be honest, traders proficient with graphic features within Microsoft Office apps such as Word, Excel or even Publisher will get the job done.

You just cut and paste Dennis’s updated SWA image and add it to the existing ones previously pasted and overlay some lines on a new layer…

Colour code and memorise your lines, so you can see at a glance what is crossing over…
|
|
Why would we close out positions on EURAUD (7.00am UTC+10) and GBPCHF (11.00am UTC+10)?

Momentum crossed back below the Green line… No SL, alternative level risk management employed.
Result… 70 Pips.

GBPCHF has moved to a consolidation phase, it’s going nowhere… Momentum is crossing back above the Red line… No SL, alternative level risk management employed. We can always get back in again later if Momentum breaks back below the Red line. Result… 15 Pips.

Notes: Something else to think about when using Dennis’s SWA Strategy… Certain Currencies are stronger than others… I’ll break them down into two groups…

Group 1 comprises USD, GBP, EUR, JPY (Strong(er))

Group 2 comprises CAD, AUD, CHF, NZD (Weak(er))

For example the USD crossing above say the NZD , the USD’s strength (Percentage) will move price more than NZD’s… ie: If USD is say 0.5% stronger than the NZD, price will move further than if say NZD was 0.5% stronger than USD… Similar theory applies to most of the 28 pairs that make up the SWA Strategy.

We have just seen this with the CHF struggling to pull the GBP down, likewise with the AUD against the EUR… And the opposite with a strong(er) USD against the weak(er) AUD and the NZD.

Using Dennis data, you can back test this with your charts by comparing trends and percentages of various pairs… Back Test… Back Test… Back Test…

Anyway, this should be enough for now… Back to you Dennis…

7 Likes

breakout move for USDJPY, this one just keeps giving

1a

4 Likes

A gem right there, I completely agree. Helps with filtering trades for more pips! Thanks

1 Like

I like the way you trade. Although, I don’t trade in this pair. I prefer trading EUR/USD the most.

1 Like

1a

2 Likes