Hi Dennis
Can see you have been using the strong weak analysis for a long time, have you tried to make it more mechanical? here I am thinking about when you take the trades
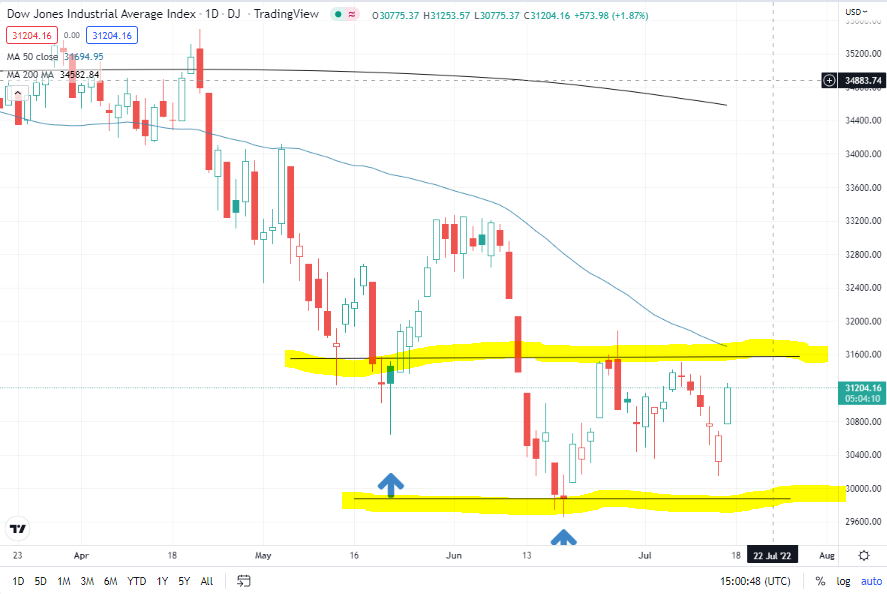
Looking at US stocks ( DOW-30) we are having a good rally today but are still stuck in a range. I am looking at the closing price of 29888 on June 17th for our low and 30934 on June 28th for our high. It is a coin toss in which one will be broken first. I am seeing nothing price action-wise that would suggest we have seen the bottom, big numbers can serve as support and 30K seems to be the number being defended so far. If anyone sees something that might give us some insight as to which way this market is likely to breakout please feel free to share
I use a simple method of speculating where price is likely to go… And it works more often than not.
I just bring up a chart with a zoom level that includes 185 - 236 candles and draw a line across the price action… The average from the top of the highest candle to the bottom of the lowest candle (not including wicks). And this is a basic average price…
The market assesses the US30 is cheap if it is below the line and expensive if it is above… Simple.
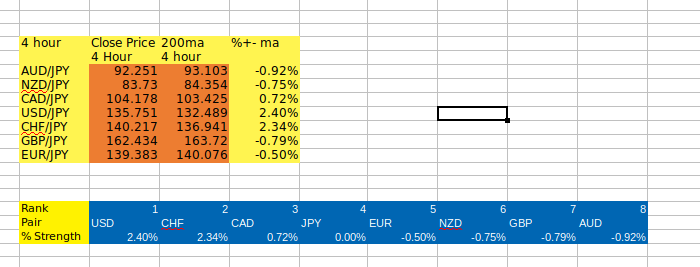
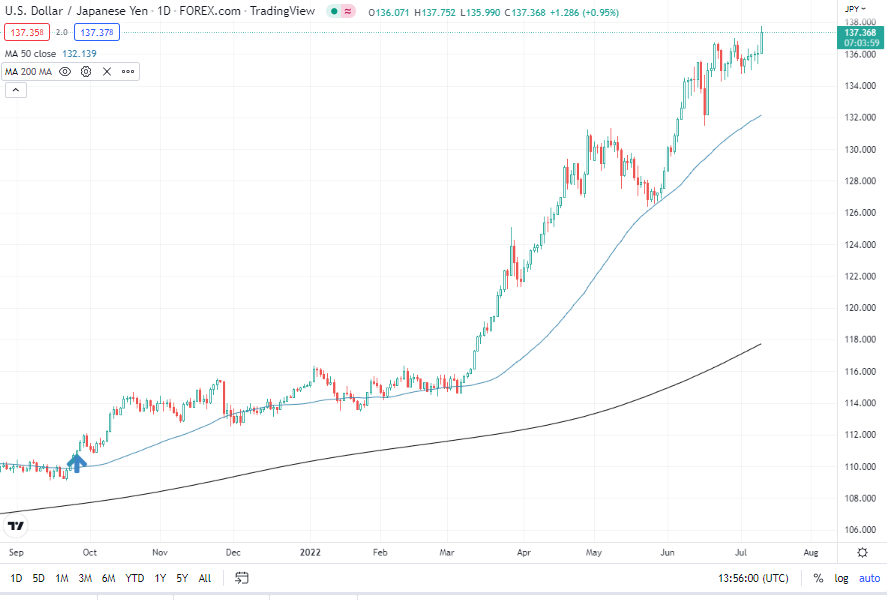
And price will more often than not move back to this level… US30 average price is currently around the 31571.0 level… So price should head back to this level. (See US30 4 Hour below)
It’s sort of mixing the MA200 level with a Fibonacci 50% type of concept…
Once I have added the level, I then scroll back through say 10 - 30 days of the chart to see how many times this level caused support or resistance activity, the more touches the more comfortable I am with using the level as a trend direction signal… Try it on your own charts, you’ll be surprised of the accuracy.
I picked up 51 pips this morning on the US500 using this strategy… SWA doesn’t work on Indices.
On the US30, my caramilla pivot indicator points to the (H3) 31690 to (H4) 32008 zone which also happens to be a 61.8% fib retracement and the 34 SMA daily confluence zone. There is bullish divergence between price and the stochastic indicator on 20 May 2022 and 20 June 2022. (On two arrows on Dennis’ chart) Lastly, the 7 week trend (35 days) on the COT report points a 3.3% push to the upside as confirmation. At best, one would then look to buy the US30 up to 31690 zone. One would also look for shorts at / around the 31690 level for a continuation of bearish momentum. Unfortunately for some reason, I’m unable to upload my chart.