A nice Friday bump of the CAD

The last few NZDCAD trades have been successful but short lived, Technically this one has a long way to drop but not one I would hang onto for more than a quick score

A nice Friday bump of the CAD
The last few NZDCAD trades have been successful but short lived, Technically this one has a long way to drop but not one I would hang onto for more than a quick score
Now this is what Yen pairs should look like when we have a green stock market

Another day of strong moves for Yen pairs

AUDJPY and CADJPY are both strong plays

Looking at the charts, it appears the aud is getting weaker…the cad and the usd appear to be getting stronger.
Look at the USD trying to make a worst-to-first move

What happened, did someone important sneeze?
On the positive side, we have a strong Yen on a day the stock market is down.

Yeah Jim Bullard did a couple of hours ago
Rate hikes do little to fight inflation as long as we have a government running a one and a half trillion dollar defect, These rate hikes are killing the private sector as government continues to grow

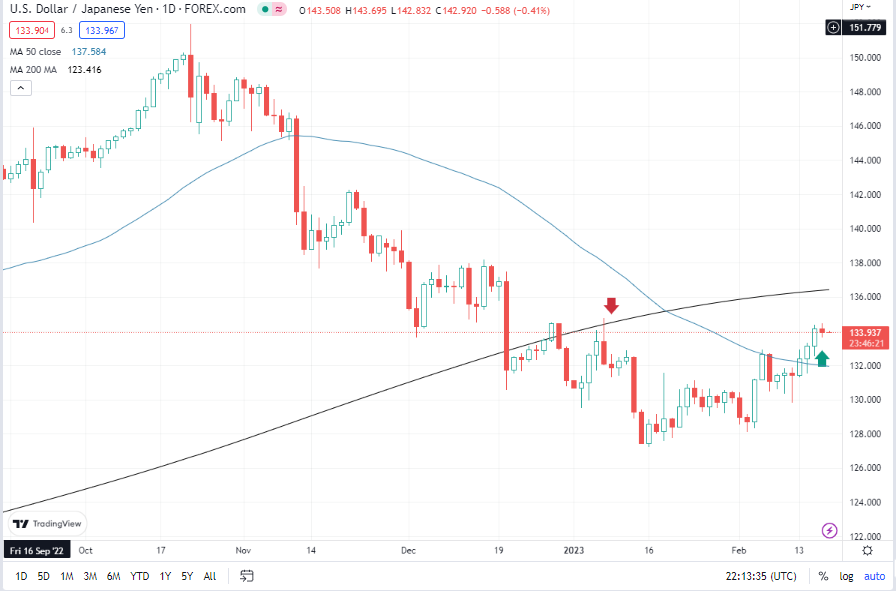
usdjpy, a nice rounding bottom…i am already long cadjpy!!!
The follow up after Asian pretty predictable - they bought USD on the back of Bullard’s sneeze.
Europeans more likely to judge the remarks just as that - a sneeze.
Interesting to see the divergence today European/US in stocks.
There used to be an old market saying over here - when the US sneezes we catch a cold - clearly the market is changing.
Anyways - below the Nasdaq with the Fed’s Bullard remarks reflected in price ;

Likewise the Dax reaction - that is until post Asian:

One other quick comment - long term vs short term.
Larry Williams likened price to a drunk making for home - the drunk staggers left to right, key is figuring where home is.
The Nasdaq chart has a yellow horiz on the hr1 - I tend to draw those and just leave & forget them, often they disappear from view until later they suddenly re-appear - a target (or as Jesse Livermore referred to as a Pivotal Point)
Anyways the yellow line back a week:

And how it came into being;
TA algos have long memories.
Apologies for hogging the thread.
Edit:
cpl hrs later at the close was there any money to be made at the pivotal point?

Good points esp in forex since supposedly the central banks use an algo to control spot prices called IPDA. Anyways, usdjpy is in a nice area to go long.
things are crowded at the top, all yen pairs were green for the week, and stocks were mixed

Current version of my forex spreadsheet shows an extreme lack of trending-ness. The thing is set up to identify and rank persistent trends. Of which there aren’t any at the moment.
Only 10 pairs of the 28 show technical uptrends or downtrends. Of the trade markers, it shows zero Strong Buy/Sell markers out of a possible max. of 4, 1 Buy marker, 1 Sell marker, 2 Weak Buys, 2 Weak Sells, 2 Very Weak Buys, 1 Very Weak Sell. This is a good time for me to stay in cash. This is a really thin dashboard.
Some commentators are fond of highlighting that there are 28 major pairs to pick from, and the forex market is the biggest and the most volatile in the world, etc. Which is true superficially but in reality this is just marketing speak - no pair moves in isolation: in some senses there is just one market and you’re either in it or you’re not in it.

mixed day for currencies as stocks take biggest hit of the year