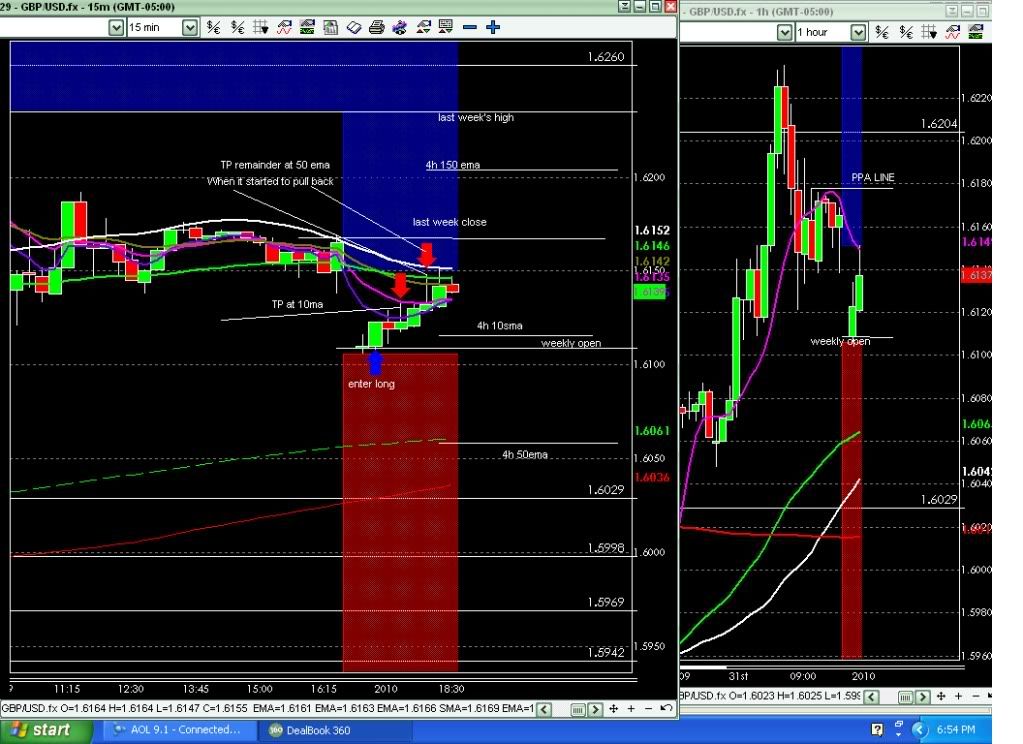
First trade of the year and it’s started off positive
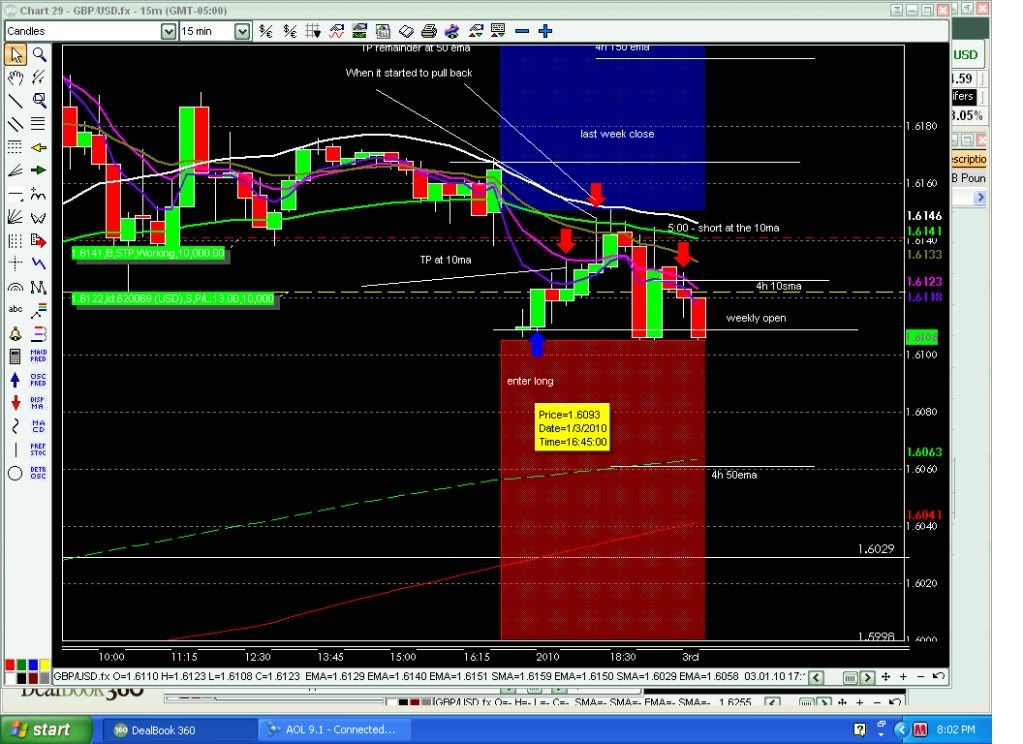
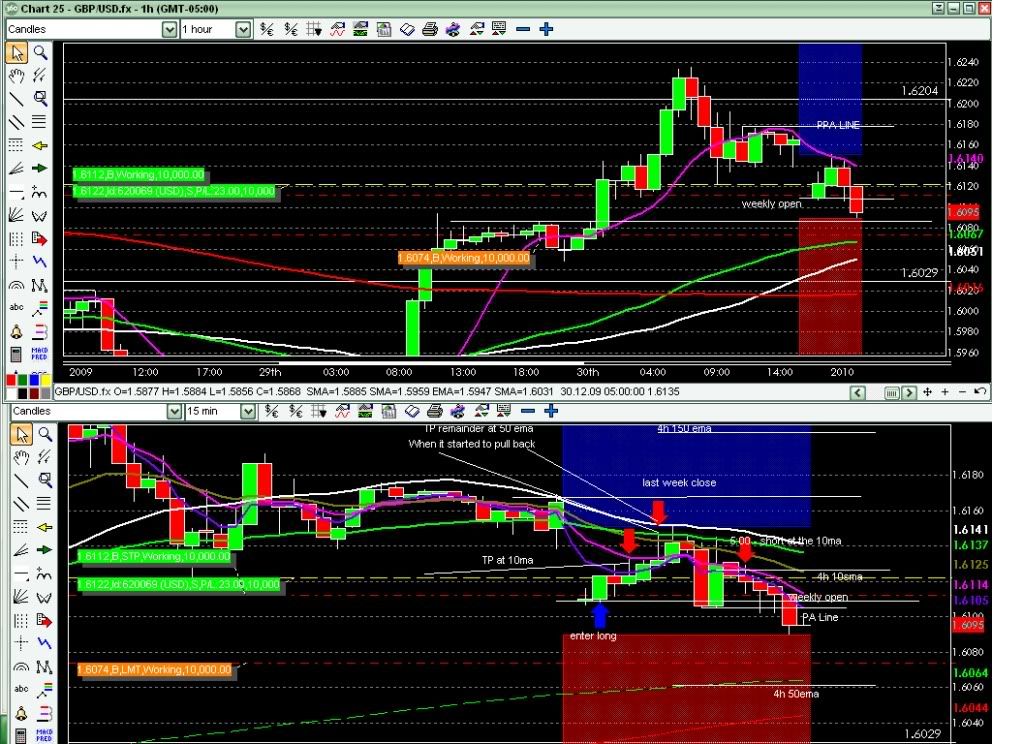
Here are my 15m & 1h charts showing my entry and 2 exits
There was a 56pip gap between last weeks close and this weeks open
The open was not on the 1h 62ema like last week, but I took the long.
I took partial profit at the 10ma and took the remainder at the 50ma.
My plan now is to study more on “manage the trade” I feel like I get out
way too early most times. When price starts heading back in the other direction, I tend to jump out.
Thanks
Jack
Great trading Jack Yes The gap gets filled most Sundays. Checkout the e/j then it turned right on a s/r line and 35 sma. I took the long also and then a short… Great start to the new year.
Here’s the 2nd trade. 5:00 trade off the ma’s. I wish I had been
confindent enough to have taken it off the 35/50
Ken, Thanks for this tread. I feel like with this method I’ve been able
to start to follow Price Action.
Jack
Be nice if it would break that suport , Might be a bit slow though.
Manage the Trade…
Looking back at PPA on the one hour looks like 1.6087 could be a line to take some profit and watch for a turn around. I have SL at +10 right now and took partial profit at 1.6093.
Looks like there is nothing in the way if price goes below 1.6087 until 1.6064
the one hr 62ema. I am setting a target for that point now. Plan then to see if there is a bouce off the 1h 62ma or if it keeps going…
Warning to anyone reading this…I am a Newbie to this…dont take any of my thoughts and plans seriously.
Thanks Jack
KENNETH lEE
Trade Inspiration Not Despiration . Member Since Nov 2008
1,867 Posts
Quote:
Originally Posted by iForex
Close half at 132.81, move the SL to 132.57
Now this trade is facing to cross 15m 35/50ma, I do not know how to handle this.
That is where we need to see that you did start to cross back over the MA’s you closed above the 62 1 Hr and the lower time frame 15 Min MA’s. This is your sign that a reversal in trend maybe in store. You have already covered and are in a positive trade. If it starts CLOSING below the minor MA’s then it may not have a enough buyers to continue. But that is the first sign.
In hindsight we can easly see that once it broke the 50 ema it did a nice retest twice and continued up. Keeping a eye on where this candles close is the best way to manage your trades.
Hope That helps Ken
That chart above after analysing your charts and noticing the values on all the different time frame MA’s this might have been one of those areas a P.O. ( Pending Order) would have been nice.
Hey Ken,
I have a question. Here is my 15m & 1h. I’m seeing short signals everywhere.
Doj on the daily, 1h closing below the 10ma & 15m MA’s are fanning out for a 5:00 trade. I took a short at the yellow arrow and got out at the green one. Now what’s next is what I am having trouble with. Is it follow the 15m MA’s down with another short when it retraces to one of the MA’s…or is it a long with all the support from the higher timeframes. I’m thinking gump trades (short) and that if price breaks support it will continue down. Or am I thinking too much?

Jack you seem to be picking up on this very well. I would have the same view as you do with this. Just keep a eye on your Closes as that is where if it turns back up it will show first. .
Thanks for the encouragement Ken,
I’ve gump traded for about 10 pips so far, but with a tight range it’s a lot of work!!
HI Ken,
I have been going through your thread and its really helpful. Thanks for the info that u are sharing. I have some doubts. I dont know if i am not doing exactly what you are saying or where else am i going wrong. Please be kind enough to explain where and what did i do wrong
yesterday i took a trade GBPUSD around 1.6040 (248 ma 15 min and 1 hr 62 ema) and put my SL around 1.6060. the price went up to 1.6062 and hit SL and start coming back. Remembering ur advice i shorted again and was right this time. it came down and i took the profit.
The next trade that i took is at 1.5994 and kept my SL at 1.6015 The price went up til 1.6011 and hit my SL(4 pips spread) and start falling down. i didnt dare to take that trade again because the previous bul candle was going up so fast.
there are few trades like this. Almost all trades are the same type .
I have read posts by you on stops and entries . I am sure that there is something wrong in what i am doing. But i find som edifficulty in finding that out. so i need some expert help in this. Can you please take some time to explain where am i going wrong. thanks a lot !
First day demo trading…
2 trades only. Both 35/50. 58 pips positive.
I’ve played around on demo accounts before, but this is the first time I saw something happen (the 35/50) and thought to myself, “I think I know what is about to happen” and it did."
Yes that is the first step. To question the possiblities then to see that the answer is the same as yours. Then you start to build trust. Then as you start to take the trades you start to build confidence. Until finally you get to the point of just seeing and taking the trade no thought or stress. Just a road map. Road turns left you go left.
Great Trading Way to Go. Ken 
Hi.
What SL do you set usually in 35/50 cross reversal trade. Do you always feel confident about this type of trade ?. ( if price cross 35/50 at retr. about 3/4 of swing do you still want to trade that ? )
Cheers.
They are pretty consistent as long as they are in the right location . which is normaly a fib level. They will either just retest the area they crossed like your did. Or they will be a complete reversal sending price backup above the top of the swing. same as with the 62 eme trade. but the fib levle on it is on the 1 HR.
A pretty tight stop is used. Id the price closes across the 35/50 more than 35 pip it maybe a clean break with no retest. So stop of 35 pips from the edge of the 35 or 50 Ma. Is usually fine. So if the price closes 10 pips past the 35/50 arae stop would be 25.
Just remember that it can and does only retest the break so be ready to take the small gains then get ready to enter in the opposite direction like after your 35/50 trade.
thanks kenneth. ur efforts Very much appreciated
hi kenneth,
please correct me if my understanding is wrong
difference between 35/50 cross and reverse and 35/50 spike through
for 35/50 cross and reverse what happens is when price close above or below 35 and 50 ma with smal wick trade the next candle in opposite direction. normally how many pips can we target for this? because i see the next candle going in opposite direction then again it turns and continues its previous trend.
35/50 spike through
the 35/50 spike through is like even though the price went past all the MA it will come back to 35/50 ma so that we can enter when the price come back touch the MA before it continue with the trend
I have doubt with this.
Is the 35/50 spike through method similar to the 1 o clock and 5 o clock trades?
last question.
is it only the 1 hr 62 ema strategy and 1 o clock and 5 o clock method the only methods where we enter when the price TOUCH the MA. All the other method we wait for close of the 15 m candle and PA?
your explanations are nice but i think its my problem in understanding. I read ur explanations and when i try to digest all those i am having hiccups with all these questions… Please do help and advice me when u get time. thanks a million! God Bless!
#379 (permalink) Today, 03:38 AM
pippist
Join Date: Dec 2009
Location: earth
Posts: 3
hi kenneth,
please correct me if my understanding is wrong
difference between 35/50 cross and reverse and 35/50 spike through
Don’t know of a 35/50 spike through trade in this system.
The only 35/50 we talk about is a reversal trade. The trade even if it breaks the 35/50 area and continues on past the 35/50 usually retest that breakout. That retest and the failure to cross back through the 35/50 is you sugnal that the trade is juat a scalp and you now have the choice to revers the trade and continue with price with the trend.
The 35/50 is a retracemnet entry. price has trended for a little while then it reverses about 1/2 the move nad during that move back or retracement . Web get one single candle that piushes through both the 35 sma and the 50 ema. The trade says to wait for the close and then enter opposite back towards the ma’s. You will find that at times the price doesn’t wait and turns before the close.
So you take the trade back towards the MA’s but as you said sometimes it doesn’t clear the otherside and just bounces off the MA’s then turns back and continues it’s retracement turning into a reversal. But the retest was a 35/50 trade it did reverse it just didn’t go very far. When you see it bounce off the MA’s time to rethink the trade / Close with a small gain reverse but the main goal at the start of every trade is to not lose anything.
But if the 35/50 reversal trade does cross back over the ma’s like it should then it should make a new high and your profit target should be choosen off your higher time frame charts. The Next S/R line Then watch PA to see if it will go even Higher.
for 35/50 cross and reverse what happens is when price close above or below 35 and 50 ma with smal wick trade the next candle in opposite direction. normally how many pips can we target for this? because i see the next candle going in opposite direction then again it turns and continues its previous trend.
35/50 spike through
the 35/50 spike through is like even though the price went past all the MA it will come back to 35/50 ma so that we can enter when the price come back touch the MA before it continue with the trend
I have doubt with this.
Is the 35/50 spike through method similar to the 1 o clock and 5 o clock trades?
Yes and No first there isn’t a 35/50 spike through trade. What your calling that is when price breaks the 35/50 area then does a retest. If you start to take notice where the MA’s are in relationship to the overall price action. If it isn’t a decent retracment. it can just blow straight through never looking back. But it is designed to be a at the major fib levels between 38 nd 61 precent . Which is why it almost always bounces at the least.
If it is past those levels it can and does break through only giving a retest.
Then 1 dna 5 O’clock trades are Trend continuation entries . They serve us the chance to get into a trend or trade we may have missed the original entry on. Then price ahs normally consoidated between sessions. Then breaks one way or the other. But you were still asleep or having coffee. So that you sit down you see it has left the bus top with out you.
At that point we start looking for a 1 or 5 O’clock secondary entry. It is normally a retest of a breakout area . One of the best is the previous sessions high or low. Also the break of a S?R line a prveious high or low any PPA can be a rea for a 1 and 5 O’clock trade giving us confirmation to take it on the touch. So always look to your left for PPA.
Price pushes through but we get a rejection of this area because many factors . Stops being hit or profit taking which causes a slight reversal usually one candle sometimes two. It pulls back to the outer lower value MA’s 5,10 or 21. We enter on the touch because it reacts fast when it hits those areas as more ppeople jump on the bus to get better entries.
The Ma’s should have started to spread out a bit and so your stops are normally placed behind the next MA. If you took the trade off the 5 MA stop behind the 10 plus a couple of pips. Always wait for it to turn back First . We say enter on the touch but really the touch and then when it starts back Because it may not be the 5 might be the 10 or even 21.
Also watch your closes if a candle [B][I][U]closes[/U][/I][/B] past the outer MA’s 5,10 or ,21 it is a sign to us that our trend may be ending. It can continue on after a pause but the chance for a 1or 5 O’clock trade may have passed.The start looking for reversal signals.
last question.
is it only the 1 hr 62 ema strategy and 1 o clock and 5 o clock method the only methods where we enter when the price TOUCH the MA. All the other method we wait for close of the 15 m candle and PA?
Yes within the system this is true. As you can exprience you will see our places to take trades straight away but in the beggining the signals will be your best friends and save you from taking bad trades. They are there to show us what price action is doing . If you stay with this you will start to see why they form and where they form. Which is all the results of price action. That is the difference of the ones making great gains using this system they see the signals forming as most of us have to wait for it whichnis ok it is only the difference of a few pips .
your explanations are nice but i think its my problem in understanding. I read ur explanations and when i try to digest all those i am having hiccups with all these questions… Please do help and advice me when u get time. thanks a million! God Bless!
Hope this helps a little as you can see from the above . The system is one trade entry area leading into the next it is laid out in MY pdf in that fashion so you can get a idea of which trade you can be looking for next with where price is at the time. This way any time we sit down at the computer we should be able to know what is coming up and focus on the one or two posiblities instead of trying to look for all the entries.
Hope your Having a Great Weekend. Ken 


