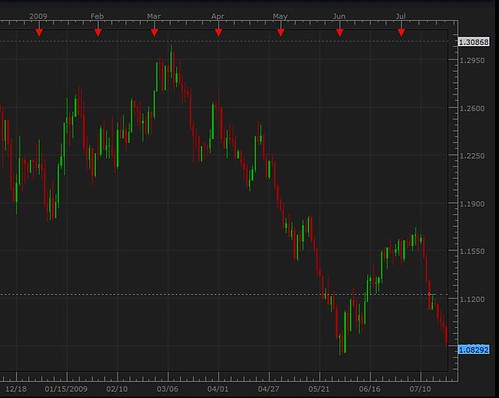
The way my chart looks on daily chart, the price is currently between long term support and resistance lines.
If it breaks the resistance at 1.1653 and closes above that today, I believe it will be going up.
If it can’t break the upward resistance and closes below the support line, it will be hitting the long term support line started on 11/06/2007.
Any thoughts ??
Attached 2 charts. Both are same but one is with a closer look.
You can tell by looking @naked price action on the 30 minutes chart. It is the area between 1.1040 and 1.1026 with 1.1036 being the primary point of resistance.
When you look at the intermarket relationship with crude oil, USD/CAD & CAD/JPY pairs you will find that the USD/CAD & CAD/JPY pairs have moved the exact same amount of pips in it’s [B]opposite[/B] direction while crude oil has been falling since NY open.
The CCI reading in the USD/CAD pair and Crude Oil are identical in it’s [B]opposite[/B] direction eg. USD/CAD is rising and Crude Oil is falling.
That indicates that there has been volume moved into the USD/CAD pair in order to hedge against a falling crude oil price which caused the USD/CAD pair to move up from it’s 1.1026 - 1.1036 S&R level [B]temporarly[/B].
The point I am trying to bring across here is…that it is not sufficient to look at S&R levels alone. If you [wish to] trade USD/CAD you need to keep an eye on Crude Oil price action and volume movements into the USD/CAD pair.
Good Analysis. Thank you !! Its always useful to know that which of the pairs related either in the same direction or in the opposite direction… It’s easy to analyze the pairs in conjuction sometime rather than focussing on one… It can also be used as a confirmation for trade setups. In fact, I am looking at CADJPY to cross the on the daily chart at 86 level… which is a head & shoulder formation. On breaking this line, I expect that it will hit 89 level… FYI… Please see the attachment …
USD/CAD nearing the lows made back in very early June. I can just see everyone try to buy a bottom right here. Maybe watching to see if oil can push through 70 and continue moving higher to the 75-80 range for a break of the low. CAD economic calendar is light next week, with only significant event I see being GDP release on July 31, so possible holding patter until then.
Keep an eye on crude oil futures with emphasis on time cycle and volume to pick USDCAD trade opportunities.
Crude oil futures @74.20 is a very important point because that’s when index funds algorithm kick in made visible through volume shifts USDCAD<->Crude Oil futures.
[B]Volume shifts=price action in USDCAD pair![/B]
Time cycle starts coming sunday/monday when asia opens.
Best to put USDCAD and Crude Oil future charts side by side and keep your eyes open
USD/CAD has rectraced all the way back to support at 1.08 from it’s high of 1.1650 area, whereas oil is still $3-4 away from the highs from mid-June. Further increase in oil could give it an extra kick in the…
Also, the increase in buyers at this point seems to be coming to fruition. SSI data on DailyFX increased from 2.5 last week to 3.3 today showing increase in long positions.
Today I put in a pending order at 1.07 but it was never executed throughout the NY session. I just cancelled that order… I will wait to see any other buying opportunity on this one.
Well my short bias has been flatly rejected today. Almost $4 drop in oil today which isn’t helping either. USD/CAD is off my radar for now because of this.
Hello,
any suggestion please for buying/ selling opportunity for the next week…today the trade was between 1.0860 - 1.0762 and finally it closed at 1.0775.
Crude Oil will start it’s move [B]UP[/B] on the 11th of August according to the COT positioning and the Sinopec/Addax deal…
[B]Sinopec’s offer represents a 47pc premium to the closing price on June 5[/B], the day before Addax announced it was in preliminary discussions with Sinopec and others about a potential deal. Its shares rose 282, or 12pc, to �26.50 in London.
Anybody want’s to know where the USDCAD pair is heading…?
Check out the Goldman Sachs recommendation for the USDCAD pair.
Similar to this Goldman Sachs recommendation last Thursday concerning the EURUSD pair…
“The dollar rallied in terms of the USDX yesterday, [B]and the Euro came under pressure as Goldman Sachs repudiated a longstanding Euro buy and hold recommendation by issuing a sell Euro recommendation[/B] as the 5 year US Treasury bond auction went sour.”
Follow Goldman Sachs and trading is going to be much more profitable for ya
I am not allowed to post links here. I’ve had my knuckles smacked, already.
Goldman Sachs send notes of recommendations to clients in regards to currencies and commodities on a regular base.
As of 29th of June 2009 Goldman Sachs USDCAD pair forecast…
[B]1.0200[/B] until end of September 2009
[B]1.0610[/B] from end of September 2009 until end of January 2010
[B]1.1050[/B] after that until June 2010
There has been no revision to date.
When you look @your daily USDCAD chart you’ll find very interesting patterns starting @5th of July 2009…one week after Goldman Sachs published it’s USDCAD pair forecast.
According to Goldman Sachs Crude Oil will go to 87…the Sinopec/Addax deal suggests 100.47.
What price did the USDCAD pair show the last time Crude Oil hit the 100…?
Thanks a lot for your help…i can see that…can u please advise me from where i can get Goldman Sachs recommendations… either by sending me a private msg or by directing me…
Thank you again and again for provided me with the previous recommendation…