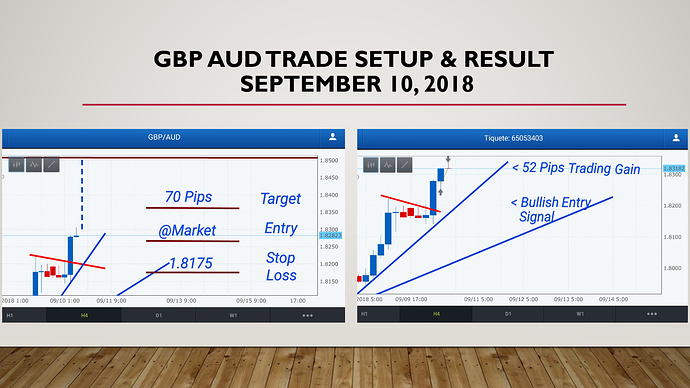
The Video Analysis of the CAD JPY 76 Pip/3.68% Gain on my Live Account shows how Japanese Candlestick Signals allow us to Accurately Predict the Forex for strong trading gains each week.
VIDEO ANALYSIS
https://youtu.be/1pyUutNfEfc.
THE CAD JPY TRADE
In this case, I took advantage of the formation of the Range Consolidation Setup on the Daily Chart.
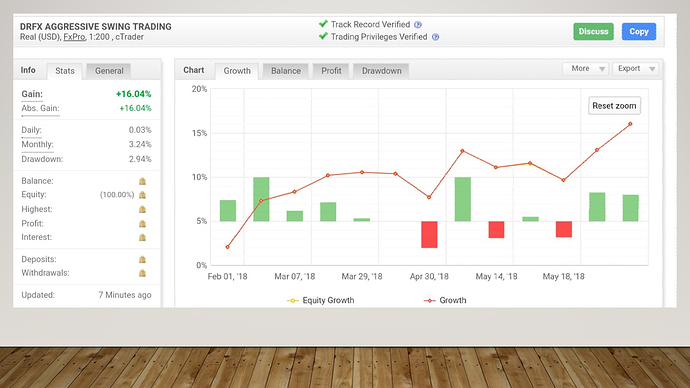
This result has meant that my Rate of Return since this new approach started in February this year is now up to 10.98% after being down from 16% as at June…
RATE OF RETURN FEBRUARY TO JUNE 30, 2018
RATE OF RETURN FEBRUARY TO SEPTEMBER 13, 2018
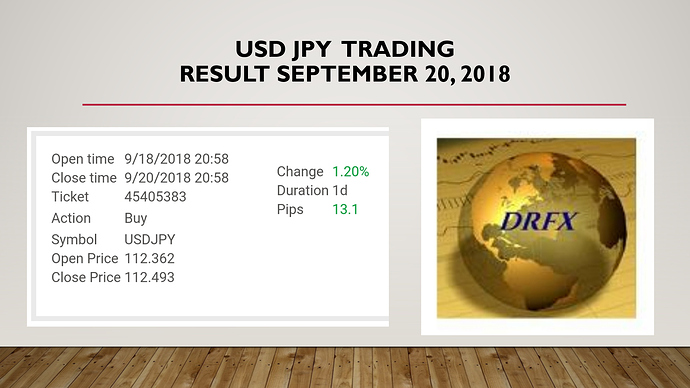
This trade along with a small gain on the USD JPY means Return for September is now just below 4%.
DETAILS OF TRADE
As you can see, this recent Bullish Movement that I traded was predicted last week as I expected the formation of this Range…
A few days later, the Bullish Signal was provided as expected…
So what was taking place was that the Resistance Boundary had already been formed with just 1 Support Point formed and the Bullish Signal and rally was then going to create the 2nd Support Point and complete the Range Setup…
Given this signal and the Bull Crown Setup on the 4 Hour Chart…
…the trade therefore had a very strong chance of rallying as expected.
I then went down to the 4 Hour Chart to look for a setup to take advantage of this pair…
There were actually 2 options for your Stop Loss.
- Placing your Stop Loss at the Support of the Bullish Candlestick Formation.
- Or place it a little higher using the Trend Lines.
The choice depends on how much you want for a Stop Loss. Both options are possible as trendlines offer a strong area to protect your trade.
I decided to use the Trendline for my Stop Loss and therefore this was the Setup I used , with the target set for the area just below the Resistance Boundary…
After the market pulled back temporarily as expected ( to offer an even better entry price)…it rallied to the Resistance Area as expected…
Exit actually took place 5 Pips before the actual target was hit because at the end of the 2-Day Holding Period I set for these types of trades, it had not yet been hit. So decided to exit for 76 Pips instead of waiting indefinitely for just 5 more Pips.
My FXCM Demo Account is used for my Analysis because of the greater clarity of their Charts…but my Live Account trades are done with FXPRO. FXPRO allows me to see the exact Risk% and Return% values and I receive alerts when trades are closed so that we dont have to monitor the trade. However, trades are done both on the FXCM Demo and FXPRO Live Account together.
…so you can see the results on my 4 Hour and Daily Charts from my Live Account…
KEY POINTS
1. NEVER MONITOR THE TRADE
Despite what is a common practice in the Forex, it is highly destructive to monitor your trades and watch the charts. Why?
After you execute a trade, the market will not always shoot to your target in a straight line. It will wave and pullback and eventually resume the movement to your target. If you watch the market and see these movements on your Live Account however, it is natural to become stressed and doubt yourself, leading you to be tempted to close trades too early. Doing this over the long term may reduce your losses , but will self sabotage your profit potential and defeat the purpose of having a profitable strategy.
This is why I recommend having a strategy with a specific Holding Period where 95% of the time it will hit the target within that time without any intervention on your part.
2. ACCURATE EXIT TARGETS
Even though the market tends to hit the Resistance/Support Boundary, there are times when it will pullback and start its reversal without hitting it. This is why I set the trading target to an area just ahead of the Resistance and as you can see from the charts below, the market has in fact started to pull back…
I call this area the ‘Near End’ Value and exiting trades here allows you to avoid sharp reversals that take away your trading gains.
So this was a great trade that showed how accurate Japanese Candlestick Signals - especially when used on the Larger Charts - allows you to Forecast and Aggressively take advantage of the profitable moves of the Forex each week.
Stick to this approach, profits will come.
More to come!!!
Duane
DRFXTRADING


