Hey traders,
Videos below.
Possible trades on EURO NZD or CAD JPY.
AUD USD
CAD JPY
EURO NZD
AUD JPY
EURO JPY
NZD JPY
Regards
Duane
DRFXTRADING
Hey traders,
Videos below.
Possible trades on EURO NZD or CAD JPY.
AUD USD
CAD JPY
EURO NZD
AUD JPY
EURO JPY
NZD JPY
Regards
Duane
DRFXTRADING
EURO NZD has 4 setups on 4H Chart which means it is oversold and a reversal is likely - risky to trade now. Plus the Daily Signal is also weak.
CAD JPY has closed with too weak of a signal. Will need another, stronger signal.
Duane
DRFXTRADING
Why you don’t share your analysis nowadays? I see previous analysis, I really liked your chart reading style.
You will still see it in the videos which include the rationale behind my analysis.
Detailed written analysis is now done mainly for trade results and my private subscribers.
Checkout the videos and any questions you have I will respond to you.
Duane
DRFXTRADING
Hey Traders…
Recent trade of 65 Pips on the CAD JPY today.
Here is the Video Analysis of the Trade Setup
And you can see the before and after of the trade in the graphs below.
I use FXCM charts to assess the market and for entry signals, but I execute my trades with FXPro ( better interface).
Overall, we took advantage of the False Breakout Reversal Setup on the Range Setup of the Daily Chart - there was an initial failed bullish breakout attempt ( incurred a small loss) that was leading to a reversal back inside the Range. After the Daily Chart gave the Strong Bearish Signal, entry took place to target the Support boundary.
DAILY CHART SETUP
4 HOUR CHART ENTRY SETUP
The Downtrend Line and the Resistance Boundary were used as safe Stop Loss Areas.
After 16 hours, target was hit…
DAILY CHART TARGET HIT
4 HOUR CHART RESULT
As you can see, market hit the target after pulling back slightly. Stop Loss was unaffected/never really threatened.
Not looking at your trades once you have entered the market is highly recommended to avoid any anxiety you may feel when watching these temporary reversals.
FXPRO LIVE RESULT
EMAILED TRADE ALERT
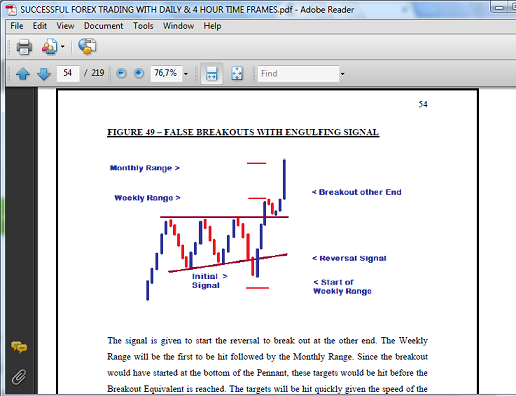
This graph below also sums up the theory of False Breakout Reversals, where the market will fail to breakout at one end then reverse sharply to head back inside to hit the ither boundary. Reversals like these allow us to make up for losses incurred in trading the initial breakout attempt.
So overall, a good trade, a quick trade and one that pushed return to 13.0% since new strategy began in February this year , with only a few small losses incurred along the way.
(Nov. 2016 - Jan. 2018 was used to extensively test and create the new strategies and thus experienced a loss of 13.6% The graph represents the performance since that period ended. In other words, just 12 trades in 4 months were needed to erase that loss)
Now only approximately 4 trades are needed to hit the 30% mark before hitting even larger targets in the weeks and months ahead…
MAIN ASPECTS OF THE TRADE
False Breakout Reversals lead to fast movements back inside of Consolidation.
Trading Targets can be set at the opposing boundary.
Targets take a shortwhile to hit their targets.
4 Hour Trend Lines and Support/Resistance Boundaries can protect your trades against temporary pullbacks.
Never Watch your trades to avoid the temptation of unnecessary interference because of minor/ temporary reversals.
Regards
Duane Shepherd
If you want to learn about the Forex market in the form of watching videos related to it then Youtube is the best source for the learning purposes. You can subscribe to the popuoar channels and push on the notifications and enjoy the learning in a visual form on daily basis. Thanks!
I would like to appreciate the efforts of video maker who tried to educate rhe newbies in an elaborated way. I think the charts which are less than 4h timeframe does not hold most of the indicators as well as candlestick patterns. Am I right?
True edmunds.lots of youtube videos out there on trading
1000s of them.
But like most things on the internet…you gotta figure out which ones give you the same recycled mediocre information…and those that give you what you need based on solid research and extensive periods of testing/trial and error.
Yes jonons…4H Charts and higher are more reliable. Fewer False Signals and whiplashes that leave your head spinning.
Smaller charts should only be used for Demo Trading when you want to just play around with the market for fun.
Higher Time Frames are for serious traders.
Duane
DRFXTRADING
Hey Traders
Videos below with the focus on the CAD JPY Result.
KEY POINTS OF THE CAD JPY RESULT
CAD JPY
GBP NZD
USD CAD
Regards
Duane
DRFXTRADING
Hey traders
Recent trade of 60 Pips on AUD JPY provided a 2.62% Return on my Live Account to push my Return to 16% in 4 1/2 months - from just 13 patient trades. 1st target of 14% has now been hit - 30% next in line.
Enjoy.
Duane
DRFXTRADING
I do not have much experience but as far as I am experienced, I think most of the indicators hold the efficacy onoy on the charts of higher timeframes. If you want to trade with lesser risk then you need to work on the daily or more than 4 hour charts. What do you think fellows?
I do not like / use indicators. However, any strategy has a better chance of being successful on these Larger Charts.
Fewer False Signals
Stronger Stop Loss Areas
Larger Pip Gains Per Trade
With this approach, most of your trades will be correct and provide you with consistent gains…
(A loss was incurred in 2017 up to January 2018 as this period was used to create the new strategies that began in February. That loss has now been erased. Use the Custom Analytics to confirm this)
Duane
DRFXTRADING
Hey traders
Here is a trade made in the Dukascopy Contest that took advantage of a False Breakout Reversal Setup on the Daily Chart of the EURO NZD.
The trade provided a gain of 120 Pips.
Questions? Shoot!
Duane
DRFXTRADING
Hey traders
CAD Pairs providing Setups that just need their Daily Charts to provide us with Strong Signals. Given that CAD Employment Data comes out today…those numbers could provide us with those Signals between today and Tuesday of next week.
VIDEO SUMMARY OF FORECASTS
Duane
DRFXTRADING
Hey traders
This video describes how I accurately predicted the reversal now taking place on the USD CHF.
Once you know these 5 factors that usually lead to False Breakout Reversals - 2 of which apply to the USD CHF - you can predict and avoid the losses associated with them and then trade them as they make their way back inside of the Consolidation.
Lets see what happens with these forecasts for the GBP JPY and USD CHF that are expected to provide trade setups between today Friday and Monday. Enjoy!
Duane
DRFXTRADING
…hey traders…if you check your charts now…you will see the USD CHF reversal signal as predicted.
Youll also notice the GBP USD gave the Bullish Reversal Signal as predicted…
Why are these reversals taking place? Due to the weakness of their initial Breakout Signals…the 1st of 5 possible reasons breakouts fail…
Lets see how much I can get from these pairs.
Duane
DRFXTRADING
Hey traders
This is what is possible on the EURO USD…movement back to Range Support Boundary. Just need the right signal on the 4 H Chart.
Duane
DRFXTRADING
Well the EURO USD declined to its target in keeping with the forecast. Had doubts about the signal given by the 4 H - preferred if the Bear Candle exceeded the 2 Bull Candles by a greater distance which is why I traded it Demo instead of Live - but still proves the accuracy of the forecast and that targets of less than 50 Pips can be had once clear and justified.
See video forecast below once again and the charts of the trade as done on my Demo.
FORECAST VIDEO
FORECAST SIGNALS
SIGNAL AND ENTRY
RESULT
Questions let me know.
Duane
Duane Shepherd
DRFX SWING TRADING
Traders!
Check out this EURO AUD trade that captured 66 Pips in just 10 Hours on my Live Account as I took advantage of the sharp rally on this pair that took place earlier this week. This was done with the Strategy of targeting gains of 50 to 70 Pips within 24 Hours.
Main Points from the Trade?
How to spot False Consolidation Break Reversals
Trading Targets to be used for these Reversals.
Entry Signals & Stop Losses to use on the 4 Hour and 1 Hour
Avoiding Unexpected Reversals.
I believe that Candlesticks offer much more for traders with the possibility of large turnover without Complicated Indicators or Conflicting Economic Data that just complicate things unnecessarily in a market that is already difficult.
VIDEO SUMMARY BELOW
TRADE SUMMARY
TRADING METHODOLOGY

SUMMARY OF THE METHODOLOGY
MARKET SETUP TRADED
TRADING PLATFORMS USED
DETAILS OF THE EURO AUD TRADE RESULT
The trade took advantage of the False Consolidation Breakout Reversal Setup on the Daily Chart, as the pair headed back inside of its Range Setup following the failed breakout attempt below Support. Once the Double Bottom Signal was given at Support to start the reversal, entry took place with the Bullish Engulfing Candlestick Signal on the 4 Hour Chart, with the 1 Hour Chart being used for Stop Loss Placement ( done if Stop Loss on 4 H would be too large).
As you will see in the video, FXCM is used to identify Market Direction and Entry Signals based on the New York Close of the Daily candle (very accurate candles). However, my Live Trades are done with FXPro because you can see the exact % Values of your Risk and Reward for each trade and you receive email alerts when the trades are closed so you do not need to watch your trades. This helps to avoid the self-sabotaging habit of closing trades too early!
DAILY CHART CONSOLIDATION SETUP & SIGNAL
4 HOUR CHART ENTRY SETUP
1 HOUR CHART STOP LOSS
THE TRADE RESULT ON MY LIVE ACCOUNT
KEY HIGHLIGHTS OF THIS TRADE
These short term targets are a lot more frequent than the larger targets of 70 to 100 Pips that I tried to capture. Once the rules are followed, large gains and faster turnover are possible. Plus since most trades close eithin 24 hours ans less as with this trade…waiting for your trades to hit their targets not that stressful.
You traded it?
Questions ?let me know…
Regards
Duane
DRFXTRADING


