Natural Gas daily Price Action chart
Natural Gas: the daily chart of the Gas shows a clear appreciation started about ten days ago after the sharp drop on 8 and 9 November (a false daily breakout). Even the weekly and H4 time frames show an upward trend, well above the moving average 21. The price of the Natural Gas has reached and broken $4.50 resistance zone which represented a 2-year low and it seems to have the strength to confirm the break out. The trading strategy could be to wait a long trading signal (better after a ritest of the key level) to enter with a purchase order with a target at $4.69 resistance zone.
Economic Calendar
The economic calendar shows today the most interesting session of the week with two monetary policy meetings (in Japan and Canada). The Bank of Japan has decided to keep unchanged its economic measures keeping the interest rates near zero and continuing with the same accommodative policy and inflation target (1.9% before 2015). Also the Bank of Canada, as expected, has kept the rates unchanged at 1% opening to new further cuts if needed. Today we received from Australia the data on inflation which rose to 2.7%, above analysts’ expectations. Several market movers arrived from the UK with the Minute of the Bank of England and the data on the labor market that highlighted a strong improvement of the British situation: the employment rose much more than expected and overall unemployment fell to 7.1% (last 5-year’s low) and very close to the target level of 7% that the central bank is waiting to consider potential changes in monetary policy. In a few hours we will know the manufacturing production in New Zealand.
The major stock indices of Europe opened with strength but closed a bit below the parity (especially Milan and Madrid); also the US indices are weak at the moment.
The Forex market shows a buying session for the pound and the euro, weakness for the US and Canadian dollar.
Tomorrow we will receive several important news as the manufacturing data from China, Germany, the euro zone and the U.S. ; the BOJ’s monthly report; the US jobless claims; the consumer confidence in the euro zone.
Maurizio Orsini
The current week has been characterized by two “main actors”: the British pound and the Canadian dollar, positively in the first case and negatively in the second one. From the UK we received, last Wednesday, the data on the labor market showing a further decline in unemployment to the 5-year lows and very close to the 7% of target set by the Bank of England. The same day we had the monetary policy meeting in Canada with the confirmation, once again, of the interest rates (1%) but this time also announcing the possibility of further cuts in rates in order to face the “not very positive” macroeconomic data and the reduced oil exports. The consequence in the Forex market has been a strong purchase of British pounds and a Canadian dollars’ sell off.
The release of the manufacturing data showed a slowdown in China and USA, a better situation for Germany and the euro zone.
For the next week we remember especially the two monetary policy meetings in the United States and New Zealand (both on Wednesdays). I leave my usual weekly analysis of technical analysis.
[video=youtube_share;Bff3haz79W0]http://youtu.be/Bff3haz79W0[/video]
Regards
Maurizio Orsini
Gbp-Usd daily Price Action chart
Gbp-Usd: the daily chart shows two sideway ranges in which the Cable moved in recent months. Since late November, in fact, the price has reached a bottom level at 1,6250 and a top on 1,66 area. Currently Gbp-Usd is right in this last level which has broken (falsely) between Thursday and Friday of the last week drawing an interesting bearish candle. The short-term trend remains bullish (even in the weekly time frame) and so a possible strategy might be to wait for the break out of the resistance, a technical correction of the price and a long trading signal to follow the trend with a target on area 1,6750. If, otherwise, we will have a short price action signal, confirming the last Friday’s bearish engulfing, we could definitely consider a sale of Gbp-Usd with target on the bottom of the laterality.
Economic Calendar
This week’s economic calendar starts with few relevant news (waiting for the important meeting of the Fed next Wednesday). The Bank of Japan released the Minutes of December policy meeting, explaining what is already highlighted in the central bank’s monthly report of last week. From Germany we knew the usual IFO index about the economic confidence which rose even more than the expectations.
The major Asian stock indices closed very negative their first session of the week, following the general negative performance of last Friday. The European indices, after a slightly down opening, increased their losses while Us stock market is around the parity.
The Forex market shows a weakness for the dollar and the gold, strength for the pound and uncertainty for the euro.
Tomorrow we remember the gross domestic product of the United Kingdom and, from the United States, the data on the durable goods orders and the consumer confidence.
Maurizio Orsini
This week 's major news were released in the second half of it and especially the day Wednesday with the two monetary policy meetings of the economic calendar.
In the United States we have the last monetary meeting with Ben Bernanke as Fed’s chairman (the next will be performed by the new chairwoman Janet Yellen) who confirmed unchanged the interest rates at 0.25% and a also a further reduction in the “bonds-buying” program from 75 to 65 billion dollars per month.
Also from New Zealand we receive the confirmation, by the central bank’s governor Graeme Wheeler, on the current level of interest rates at 2.50%.
Attention to next week because a very high volatility is expected, considering the three monetary policy meetings and the monthly data on the U.S. labor market.
I just prepared my usual weekly video of chart analysis to show you the trading opportunities for the next market opening!
[video=youtube_share;KL7HNbLCk_s]http://youtu.be/KL7HNbLCk_s[/video]
Regards
Maurizio Orsini
Gas, daily Price Action chart
Gas: the chart of this commodity shows a strong upward movement generated in the latter part of January, which reached a top level in $5.50 area. Then the price has reacted strongly (also due to many profit-taking) arriving at level $4.70 in Friday’s session and confirming the weakness also at the beginning of today’s session. The support area I just mentioned represents a key level on the daily time frame (with the approach of the moving average and the 50% of Fibonacci’s retracement) in which it could be possible to see a long trading signal to enter the uptrend. In case of a bearish break out we might always find another buying opportunity in the second level of support $4.50 (significant in the weekly time frame!) always with a target on the resistance level $5.50.
Economic Calendar
Today begins a very interesting and volatile week from a macroeconomic point of view with three monetary policy meetings along with the release of the U.S. labor market data. In this Monday we can remember a series of data on manufacturing production in Germany and in the Euro zone (both better than expected), UK and USA (lower than the forecast).
The stock market today has been pretty weak with negative close for Tokyo and the European indices.
Tomorrow’s economic calendar will present the monetary policy meeting in Australia, with the analysts’ forecast for a possible continuation of the current conditions. From Oceania we will also receive the labor market data of New Zealand.
Maurizio Orsini
Daily forex technical and fundamentals analysis help to everyone to get best profit from their tradings.
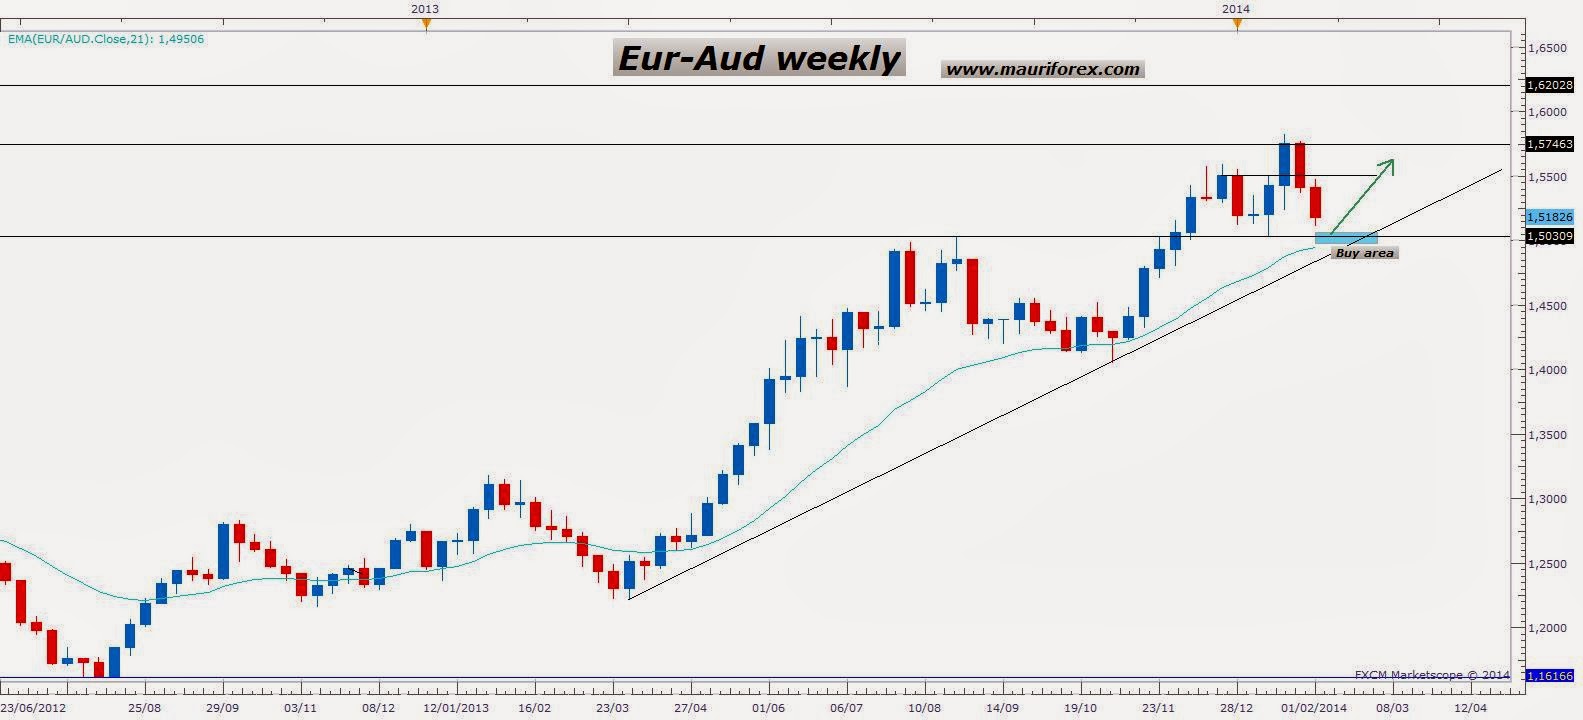
Eur-Aud, weekly Price Action chart
Eur-Aud: the daily chart shows a bearish movement emphasized by the strengthening of the Australian currency after yesterday’s monetary policy meeting. The price is actually moving below the EMA21 and close to the bottom of the short term lateral channel. This price level (1.5030), however, coincides with a major support area on the weekly time frame in which the Eur-Aud reacted strongly in the past (in 2000) and recently in last August. Therefore, in line with the medium/long term upward move, we could search in the area I just mentioned (also with the help of the moving average 21 as a dynamic support) a long trading signal, maybe in the daily chart, to open a buying position
with a target in the first resistance 1.56 and then in the previous highs.
Economic Calendar
After the “surprise” arrived yesterday from Australia (not referring to rates, unchanged, but to the monetary outlook of the central bank) today’s session was marked by medium relevance news and in particular data on the PMI service from Germany, euro zone and UK, all lower than expected; the European retail sales, also below the forecast; the U.S. non-manufacturing data, better than expected.
The Nikkei index closed rebounding, after yesterday’s fall, contrary to the Australian stock exchange that had a negative performance. The European indices opened and closed slightly negative; also the US indices are weak at the moment.
Tomorrow ‘s economic calendar will open two days of high volatility with two monetary policy meetings in the UK and the euro area (analysts’ expectations are for a confirmation of the current rates, but beware of possible surprises by the Bank of England in relation to potential reductions in quantitative easing!). Among other market movers we will have the Australian economic confidence and the US jobless claims.
Maurizio Orsini
Maurizio Orsini - YouTube
As it usually happens in the first week of each month, also in these days we saw very important market movers all together.
We had three monetary policy meetings and they all showed a confirmation in the interest rates. In Australia however, for the first time in recent months, there was no mention about the possibility of further rate cuts, which has been considered by analysts as a potential change in the accommodative monetary attitude of the central bank (with an obvious bullish reaction of the Australian dollar).
On the contrary, the European Central Bank is available for further measures of intervention to face a difficult situation of the euro zone, but at the moment nothing has been specified in this regard. Mark Carney, in Great Britain, kept the asset purchase unchanged at 375 billion pounds per month, still waiting for positive confirmation from other macroeconomic data.
I leave you my video analysis with the most interesting opportunities for the next week!
[video=youtube_share;tVAJNLRQzu4]http://youtu.be/tVAJNLRQzu4[/video]
Regards
Maurizio Orsini
Chf-Yen, daily Price Action chart
Chf-Yen: like other pairs with the yen also Chf-Yen is in a very interesting area of the chart and the price action might certainly clarify the situation between the long weekly trend and that short daily one. In fact the daily chart shows a bearish phase that began in late 2013, with the price in line with the moving average 21. The weekly time frame, otherwise, shows a bullish outlook with a long reaction occurred a few days ago just above the same EMA21 (dynamic support) which generated a climb that just broke the 113.70 resistance area. A long trading signal in this level (now support) could confirm the weekly trend and push Chf-Yen also to the top area 118 (reaching the profit target of my long trade currently at risk free). On the contrary, a return below the support may generate a bearish move to the weekly next support zone 112.
Economic Calendar
Unlike last week, the economic calendar will show in the next few days a quiet situation, with few high volatility expected market movers and no monetary policy meetings. Also today, in fact, we only had medium importance news like some data from Japan, the Swiss labor market situation (in line with the forecast) and the investor confidence in the euro area (above the expectations).
The Nikkei index ended the first session of the week rising and also the European markets had a positive opening (except Milan and Madrid) and closed contrasted. Wall Street’s indices are slightly negative.
Also tomorrow the macroeconomic calendar will highlight no important market movers: we will have the delivery of the monetary policy report to the House by the new Fed’s governor Janet Yellen and the data on economic sentiment in Australia . The Japanese market will be closed for the National Foundation Day.
Maurizio Orsini
Gold, daily Price Action chart
Gold: yesterday’s session may have given a greater clarity to the rather uncertain situation of the gold. The yellow metal was indeed within an uptrend in both the long term and the short term (not very strong) but still within a downtrend in the weekly time frame where the key area $1.270 represented a static and dynamic resistance level (the EMA21 to the downside as a “wall”) that could push the price down again. Otherwise yesterday we had heavy buying of gold that caused an upward breakout of the level just mentioned, showing a far more bullish than bearish outlook. To avoid, however, the risk of false daily breakouts it would be more prudent to wait for a clear long trading signal (maybe right today?), possibly in the $1.270 or $1280 area, to take advantage of a continuation to the upside with a target on the next major resistance $1.350 .
Economic Calendar
The macroeconomic calendar today showed us some major market movers compared to the previous two days; we remember the industrial production in the euro area (falling below the forecast), the inflation report by the Bank of England and the speech of its Governor Mark Carney. The chairman showed a positive recovery for the UK situation with an increase in 2014 GDP estimate to 3.4%, and the achievement of the 7% unemployment target before the estimated date.
The Japanese Nikkei index after the yesterday’s close for national holiday, ended the session upward. Also the European stock indices opened and closed positively; the US indices are weaker.
Tomorrow the focus will be on the Australian labor market data, the German inflation, the ECB monthly report, the US retail sales and jobless claims, Janet Yellen’s speech in the U.S. Senate.
Maurizio Orsini
I don’t think gold will reach the 1350 mark just yet maybe 1320 befor decline back to 1280s area
Ialso think the usd going to get very strong within the next few weeks
well, at the moment the price action is showing some thing different but…maybe you’re right…let’s see what will go on!
Bye friend
The current week highlighted three interesting situations: the difficulties in the Australian labor market, the confirmation of the U.S. monetary policy and the recovery of the British economy.
In the first case, we had the release of the labor market data in Australia showing a slight increase in unemployment and a fall in employment (and consequently a depreciation of the Australian dollar).
From the United States (with the speech of the new governor Janet Yellen at the Congress) it’s been confirmed the continuation of the monetary policy by the Federal Reserve, which will continue with its plan to reduce the asset purchase (tapering) without increasing, at the present time, the level of rates.
In the United Kingdom it was published the Bank of England’s inflation report that showed an improvement in the UK economy: an increase in the estimate of the gross domestic product and the achievement of the unemployment target (7%) before the year-end deadline.
For the next week we remember the monetary policy meeting in Japan and the release of the Minutes of the last monetary meeting by the Bank of England and the Federal Reserve.
I leave you my weekly video to share with you some of the most interesting trading opportunities for the next days!
[video=youtube_share;MV25wVwkHr8]http://youtu.be/MV25wVwkHr8[/video]
Have a nice week-end!
Maurizio Orsini
Usd-Yen, daily Price Action chart
Usd-Yen: the daily chart of the second most important Forex pair shows a downward trend with the price below the moving average 21 but, despite this, the trend in the medium and long term is still bullish. As a matter of fact, the weekly chart showed a reaction of the Usd-Yen in the daily support 101,50 and especially in the dynamic area represented by the EMA21 that could push the price up again. In this time frame we can also observe a possible continuation pattern (flag) whose break-out might favor the bullish move with a medium-term target even in 109 resistance zone. Let’s look for a long trading signal, possibly on the daily chart.
Economic Calendar
The current week starts in the sign of Japan: waiting for tomorrow’s monetary policy meeting, we received data on industrial production and gross domestic product today. In both cases, the news was not good considering the fall in production and the economic growth well below the expectations. In this sense, the implementation of new tax reforms by Prime Minister, Shinzo Abe, and also an increase in the central bank’s quantitative easing is likely to be realized.
With the U.S. market closed for the holiday of Washington’s Birthday, the Japanese Nikkei index ended today a positive session. Few movements and around the parity for the European indices.
Tomorrow, as mentioned, we will have the meeting of the Bank of Japan to decide on the interest rates and the monetary base. We will also know the Minute of the Reserve Bank of Australia, the British inflation, the German ZEW index, the confidence in the euro zone.
Maurizio Orsini
Aud-Chf, daily Price Action chart
Aud-Chf: the weekly chart shows a clear downward trend began almost a year ago with Aud-Chf almost always below the moving average. After the first heavy fall of 2013 we had a correction move that drew a continuation flag and could generate (always in the weekly time frame) a depreciation to the technical target 0,7350 area. After the next price drop in late 2013, Aud-Chf is in a medium-term sideways movement between 0,7780 and 0,8180 levels; the EMA21 is approaching as a dynamic resistance and, considering what mentioned above, it would be very interesting to find a short trading signal to enter the bearish movement. The price is quoting slightly above the moving average on the daily chart and so we might also see a retest of the resistance 0,8180 to search, right in this zone, a short opportunity and sell at an even better price. Care bearish break-outs of 0,7950 level which could accelerate the decline of Aud-Chf.

Economic Calendar
Great Britain and United States were the protagonists of today’s economic calendar with high volatility market movers. From the UK we had the release of the Minute of the last BOE’s monetary policy meeting (which confirmed its expansionary forward guidance) and also the labor market data (with a fall in employment and especially an unexpected increase in unemployment, the first after 12 months, that moves away from the 7% threshold). From the United States too we will receive within a few hours the Federal Reserve’s Minute to learn about the reasons behind the decisions of the last U.S. monetary meeting.
Affected by yesterday’s weakness, Tokyo closed the session losing 0,50%. Also The European indices opened weak but recovered thanks to the positive situation of Wall Street (at the present time).
Tomorrow it will be an intense session in a macroeconomic point of view with a number of manufacturing data (from China, EU, Germany and USA): the services PMI and consumer confidence in the euro area; inflation and jobless claims in the US.
Maurizio Orsini
The week ending today showed a surprise from the UK: a rising unemployment. This one, close to the target of 7%, rose to 7.2% after twelve months of continuous decline, with an obvious weakening of the pound.
We also had the publication of the minutes of the latest monetary policy meeting in Japan, USA and United Kingdom with no change compared to the current policy.
We had another drop in Chinese manufacturing output and, in this sense, we also had no positive data from Germany and the euro area.
In the Forex market we saw a recovery of the US dollar, a variability of the euro and a still strong Australian dollar.
Next week will be full of macroeconomic data (no monetary policy meetings) particularly in relation to gross domestic product and inflation.
Let’s see together some of the most interesting chart situations in my usual weekly video!
[video=youtube_share;NOEnEf8gkAg]http://youtu.be/NOEnEf8gkAg[/video]
Regards
Maurizio Orsini
USOil, daily Price Action chart
USOil: the daily chart shows a clear upward movement that began in mid-January and led the WTI price from $91 to $103 last week. The short-term trend, clearly rising and above the moving average, had an acceleration after the break out of the $100,30 resistance level and then began a few sessions of technical correction due to profit takings. The strategy is to enter this upward move and, in this sense, a long trading signal in the level just mentioned (which is now a support) would be perfect also to buy at a better price. In the event that the very short term bearish momentum would end “in advance”, we might evaluate a bullish price action set-up also in the intermediate support $101,40. In both cases, a possible target of the USOil could be the resistance area $104 (top of the last five months).
Economic Calendar
The main macroeconomic news earlier this week came from Europe with the usual German IFO index on the economic confidence (rising, above expectations) and data on inflation in the euro area (steady at 0,8%).
Asian stocks have started this last week of February with weakness (slightly negative close for Tokyo). Around the parity has been the European opening which closed positively. US indices are bullish at the moment.
The economic calendar for tomorrow will present the inflation expectations in New Zealand, the gross domestic product of Germany, the consumer confidence in the United States.
Maurizio Orsini
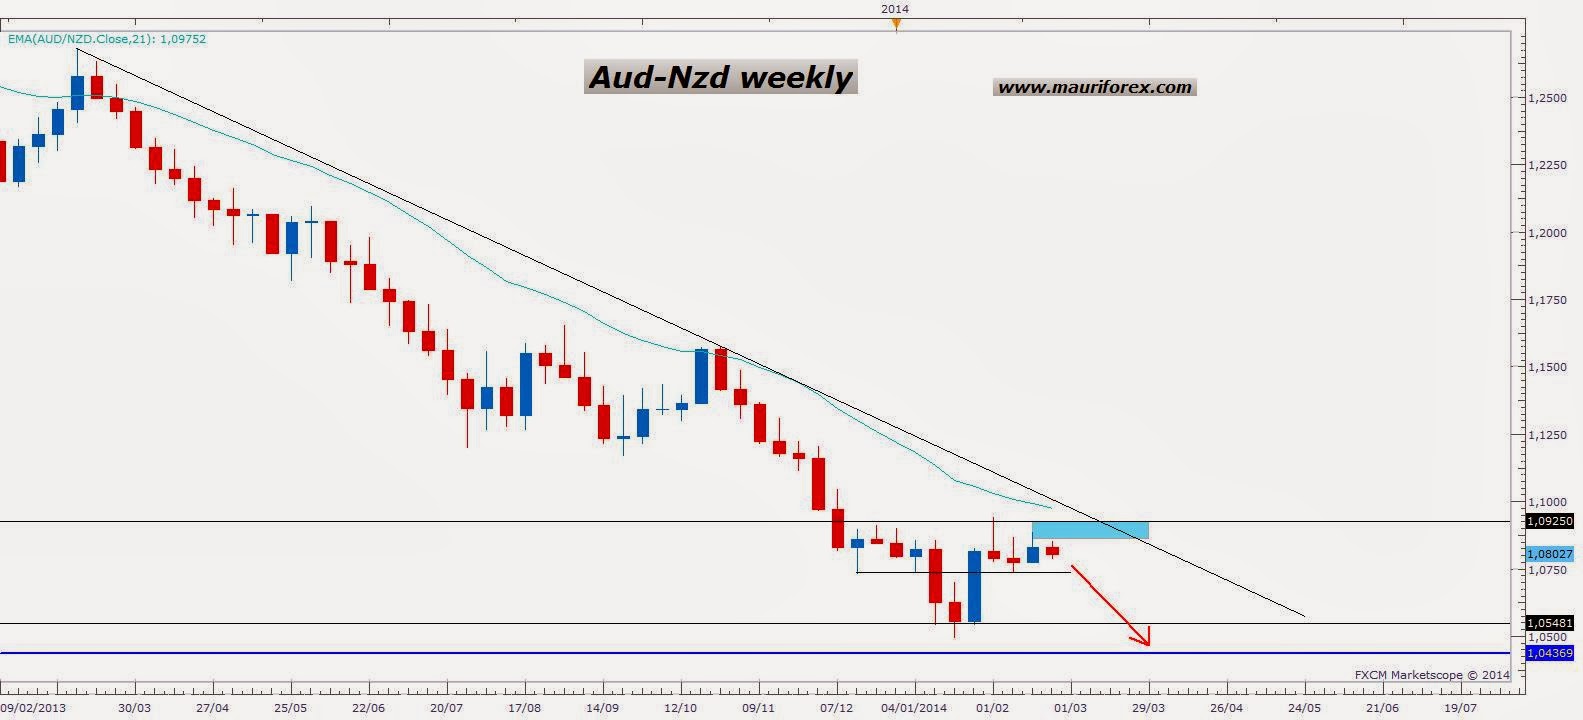
Aud-Nzd, weekly Price Action chart
Aud-Nzd: this pair is in a medium/long term clear downtrend, currently moving in a lateral range between 1.09 and 1.0550 levels. This accumulation phase could be similar to the one Aud-Nzd has already drew between August and November 2013 and might continue with the possible resuming of the downward movement towards the historic low 1.0430. Considering also the approach of the moving average in the weekly time frame, we could evaluate a short trading signal to sell this pair in a very interesting price area.
Economic Calendar
Today’s economic calendar immediately showed a good data on consumer confidence in Germany (increased despite the bearish forecast). From United Kingdom we received the gross domestic product (unchanged at 0,7% as expected) and from the U.S. the new homes sales (sharply rose)
In the stock market we saw a negative close for Tokyo; also the European indices were weak while north American stock market, at the present time, is rising.
Among the most important news of tomorrow we will have the gross domestic product of Switzerland, data on employment and inflation in Germany, the economic sentiment in the euro zone, durable goods and jobless claims in the United States, the speech on monetary policy by Fed’s chairwoman to the U.S. Senate.
Maurizio Orsini
The current week has been fairly quiet with “ordinary” market movers that have not generated strong market movements and without monetary policy meetings … a sort of “calm before the storm.” In fact the next week, as often happens at the beginning of each month, we will have many high expected volatility news all together and they might change the equilibrium in the Forex market: four interest rates decisions (Australia, Canada, UK and Euro zone ), US Non Farm Payrolls, news on the labor market in Canada and Switzerland, many manufacturing data etc…
Take a look at my usual weekly video to see, from a technical point of view, some of the best opportunities for early March.
[video=youtube_share;ABWO8dg_Joc]http://youtu.be/ABWO8dg_Joc[/video]
Regards
Maurizio Orsini