GBP a bit of an out-performer there it seems when compared to all of the other majors. Don’t particularly see why either given the weak data for GBP during the week. Potential short if you think the USD recent run has legs perhaps.
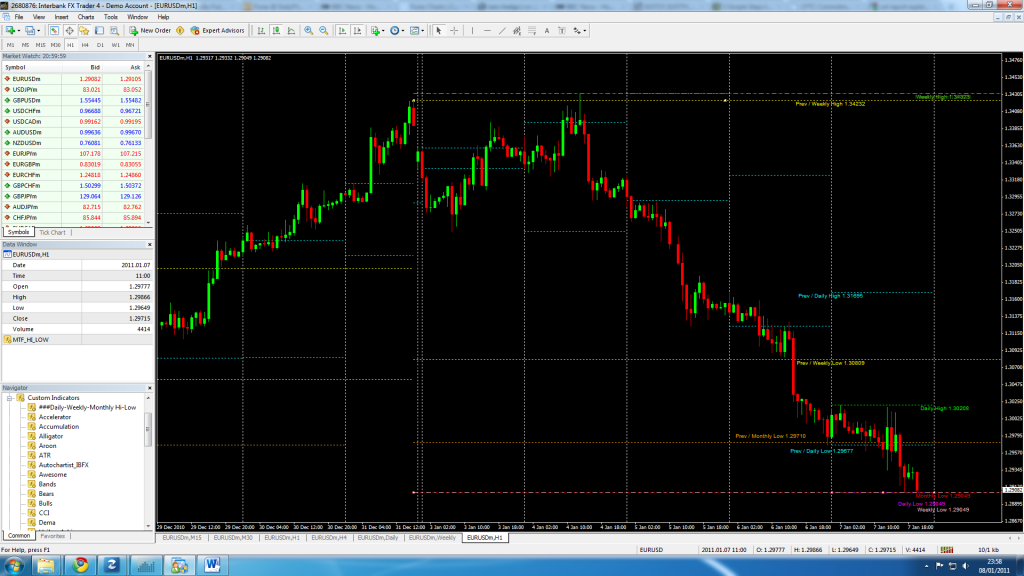
Perhaps people are using this already but I came across a handy MT4 custom indicator that automatically populates your chart with a line showing the daily, weekly and monthly high / low as well as previous daily, weekly, monthly highs / lows. Posted a screenshot below of how it looks - it’s a 1H EUR/USD chart with each day divided up using the period function.
The high / low for the day is shown in green. The previous day’s high / low is shown by the two blue lines in Jan. 7th section. The daily high / low for 2 days ago is shown by the two blue lines in Jan. 6th section and so on. Does the same for weekly / monthly current and previous highs / lows.
I’ll post the MT4 file it up here with a h/t to the source if people would like to use it. I find it saves me quite a bit of time anyway.
No probs - here you go. With thanks to amenlo9 from the FF forum where I found it. The placement of the text boxes can be a little haphazard or on top of each other but you can move them around easy enough - the colour coding makes it an easy enough read anyway.
No probs - here you go. With thanks to amenlo9 from the FF forum where I found it. The placement of the text boxes can be a little haphazard or on top of each other but you can move them around easy enough - the colour coding makes it an easy enough read anyway.
I realize I have mispelled, ommitted or misrepresented figures in these videos and when I am complete… I will go back over and touch them up and re-record them all in HD quality… however between the emails I answer and work in presenting the material… I would be that much longer in completing them lol. :o
If you see something I might not have seen or noticed, please let me know… so I can have the videos accurate and crisp when it’s all said and done.
On the Pivot calculation formula slide I ommitted the lowest low determination in the instruction but I’m sure this didn’t get by most of you as the formula is right next to the instructions.
Please critique my analysis of GBP/USD:
Attached is a daily chart of the GBP/USD pair that I was recently trying to analyse using ICT’s method’s and price action. Any comments, corrections or advice would be welcomed! =)
On the daily chart, I labelled a few more noticeable swing highs and lows (green arrows), although I’m not sure if they are intermediate highs or lows or short-term.
Price broke through the swing low boxed in light purple, so bearish sentiment is apparent. I drew fibs on the two more current swing high and swing low, as well as pivots and saw confluence just below the 1.5570 level. Since price is above central pivot, it is adviced to short. I then scroll back to historical prices and realized that it was a strong S&R level (blue line). As I zoomed in my time frame to M30, I realized price was not able to close about the resistance level.
Favouring a bearish trend, I believe the smartest choice would be to go short. But at the same time, I also see a pin bar indicating bullish strength.
That’s about as far as my analysis goes, I believe a short would be the best decision. 3 levels of confluences outweighs the candlestick pattern, as pretty as that pin bar seems, the doji before it indicates indecision…
Critique away! That’s about as much as I can remember now.
I was wondering…how does Price Action trading and news go together? Do you consider news items when you trade?
As a newbie, I have gotten into lots of situations where news has led me to paralysis. Take the Irish debt crisis for instance. It seemed like everyday the news would sway my decisions. Sometimes it would be favorable for the EURO and then the next day it would be bad. Because of this, I ended up not trading all together.
Was just wondering how news fits into Price Action. I took a look at Nial Fuller’s site and he says he doesn’t consider news at all. But I’m not sure if that’s also a good idea.
Using the Top-Down Analysis from a previous video:
USD Dollar Index - rising but seems to be stalling out before Nov high of 81.45. Might mean that DXY is rangebound at the moment. If it can’t push past the 81.50 level in a meaningful way this could be potentially bullish for GBP/USD in the short-term as DXY drops back into it’s range starting from Nov 30.
COT Report - we’re not at extremes of difference between Non-Commercial and Commercial traders like we were back in the first half of 2010. So I’d say we’re still following the Non-Commercial bear trend for now given that 64.39% of Non-Commercial traders are short. This is an increase from 63.20% in Dec 28 COT and 60.16% in Dec 21 COT.
Treasury Yields - the 2-yr and 5-yr notes have put in some new short-term lows but the 10-yr and 30-yr haven’t done so yet. If they exhibit a failure swing this could be bullish for DXY and lead it to push above the 81.50 level if I understand it right?
Looking at the S&R it looks like to me that there’s some decent resistance in that whole 1.5565 - 1.5600 area. Yesterday’s high was 1.5600. 2 day’s ago high was 1.5578. 3 days ago high was 1.5565. If it can push past those I’m looking at 1.5645 as last week’s high. There’s also a pivot at just over 1.56 (on my charts anyway) and we’re running into midpoint resistance at the moment around the 1.5575 area.
Market Flow - appears to me that we’re putting in a series of lower Swing Highs since the start of the year. Would have be favouring the short side.
So, I think I’d look for a little strength to show in DXY and enter short around the 1.56 level or look for more weakness in DXY, wait for 1.56 to be broken and target 1.5645. Overall I prefer the short side in this trade though but we might end up seeing GBP/USD kind of rangebound this week until Thurs / Fri and some major news events.
Thanks for taking the time to write up your analysis PipBandit. It is comforting to know we have the same figures on the COT report, the same analysis of the US Treasuries, and the same S&R levels. I have also been monitoring the difference between UK and US 5yr notes and have noticed the gap narrowing since the start of November (and presumably QE2). US rates have been rising faster than UK rates (hence the narrowing of the differential), but this has reversed since the end of Dec. The UK rates continue to rise slightly, while the US rates have come off. This could potentially signal strength above 1.56??
The 5-yr, 10-yr and 30-yr all started ticking up again today and DXY seemed to have found support at 80.80 which corresponds with Dec 21 - 23 resistance highs and Jan 7 support (roughly). Led me to take a demo short at 1.56 (yesterday’s daily high) with 20 pip stop and 40 pip target. Worked out nicely which is something I can’t say about many of my GBP/USD trades in a while.
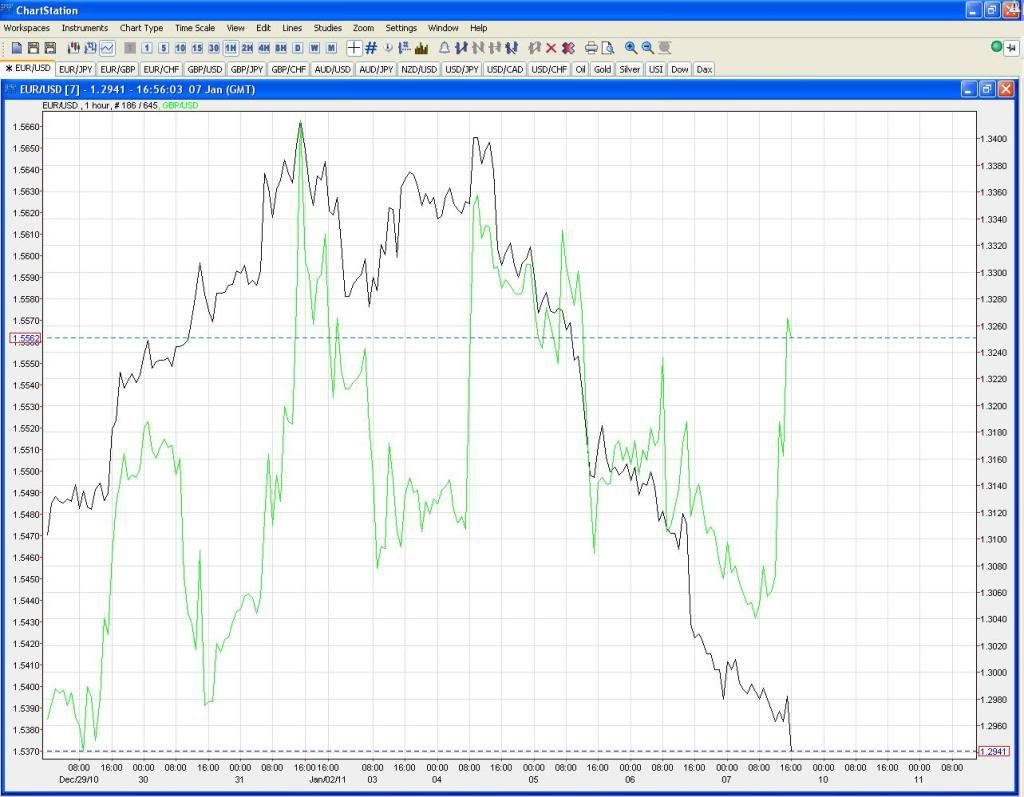
EUR/USD would’ve worked out equally well using more or less the same setup - the previous weekly low of 1.2970 has been holding pretty well so far this week bar the quick pop up during the Asian session this morning.
Thanks ICT for pointing out and linking these extra tools - finding it helpful so far to add some structure to trading overall.
I think calling it looking at a variety of TA to try and get an overall picture would be more accurate for the most part. I kind of like the whole looking across different areas approach as I find it all pretty interesting and they are all connected. Ultimately I’d like to do forex full-time but looking solely at a couple of charts all day feels like it might get a bit stale pretty quickly. Looking at TA as well as market fundamentals helps keeps things interesting for me. But if your approach works for you then have at it
Although as we are trading right now… I’m in scalping mode… as I want to see more movement to get us out of the choppy conditions were seeing for Cable.
I was about to bank 80 pips long on the Cable… but it was tough for me today.