Did anyone catch the awesome USDCHF trade last night? A perfect OTE short at the LO, falling 200 pips to fill the gap at the LC, then a bounce off support at yesterday’s high up 100 pips. I have to start getting up in the middle of the night.
edit:
I’m just posting this because it illustrates alot of the things ICT has been talking about, especially the importance of the London session, the high or low often being set during the first half of London, kill-zones etc.

Only trade I caught was based upon the trading strategy that ICT was describing yesterday, on cable.
It went exactly as described… I am, as good ol’ Alan G would say, “irrationally exuberant” at the moment 
Just pocketed 1/3 of the trade at 30 pips so far, and watching what happens with the rest.
There has been some talk regarding COT this last week and so it is probably a good time to revisit the thoughts that I posted on July 19th. As you can see from the above, I was calling for higher prices even though the Cable had been making lower lows and lower highs since April. This was a strong downward trend line, and all of the ‘dumb money’ would have been looking to short the pair.
cont…
My reasoning was based on the following:
Graph 1: Commercials at a 1 year extreme on July 12th
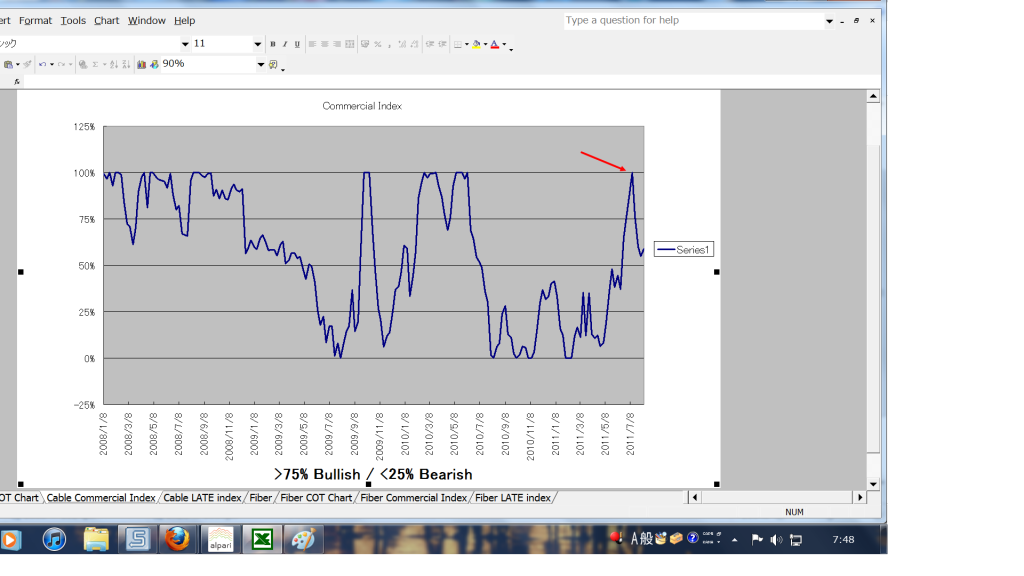
Graph 2: Non-Commercials 3% shy of a 1 year extreme on July 12th
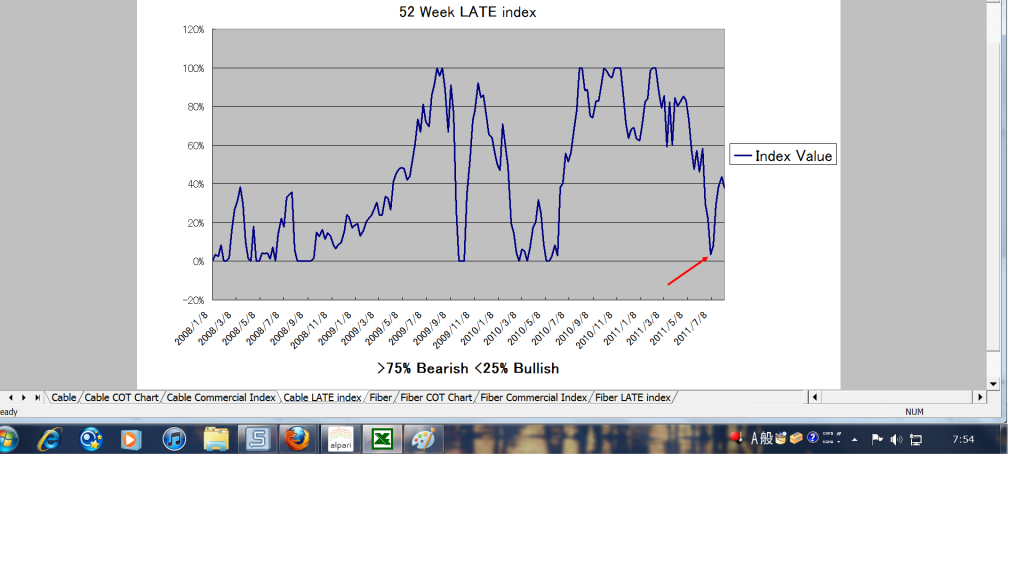
At the same time Williams%R was oversold, and Stochs was oversold. What I didn’t know at the time, but later found out was that the pound can experience strength at the start of each quarter - July being the start of the 3rd quarter of the year! ADX was also showing a bullish divergence, but that is one to be explained at another time, or by another person!
So anyway, my set up was good, and this is what I shared in the thread on July 19th. The problem would have been my entry. On the day that I posted I said I was looking for a STL to get long because I had anticipated that the spike down on the 12th was going to be a ITL. I was expecting this low to form at 1.5950, but little did I know then that the STL was being formed as I wrote - that being 1.6000. So I was 50 pips out which meant I would have missed the initial 460 pip up move. I say ‘would have’ because I acknowledged at the time that I was still in ‘study mode’ - I am now more confident having spent the last 3 weeks on this stuff.
So in the words of Larry Williams, there are two main components to these trades: “The set up (which is not a reason for entry), and the entry which is a timing mechanism (not the reason for the trade).”
So when ICT called for us to say where we all were in our understanding, well this is where I am with regard to the intermediate term trades. I do believe that I have pinned down my understanding of COT, OI, Coms and Non-coms, seasonal tendencies, Williams%R, premiums in the futures market (Pinch and Paunch signals, ADX Divergence), but I need to be a little bit more flexible with how I act on these set-ups i.e. how I enter.
…and one last post which is pure indulgence! Nobody can predict that far in advance, but wouldn’t it be sweet 
Best regards
Ali
This is great guys, it seems to have drawn the same levels as I did manually. and it shows all the profiles from previous weeks, so I’m thinking this can expediate the learning of this tool!
Thanks PipBit!
Jaroon,
I agree with you completely regarding COT data.
My way of looking at COT data has always been the [I]exact reverse[/I] of what Michael is teaching. I have always keyed off of the [I]large speculators[/I], and basically ignored the commercials. This is the method that Kathy Lien has taught for years, and it’s what made sense to me.
Whenever I’ve used COT data, it’s been for confirmation only, not as a primary decision tool. And I have to say that I’ve never placed major importance on COT data.
I hope that Michael will return to this topic, and clear up some of the confusion (although, maybe you and I are the only two who are confused).
I’m pretty sure Michael has said he only uses the COT data for his Position trading, and pretty much ignores it for his swings/scalps. Correct me if I’m wrong Michael!
Personally I am not practicing any type of position trading, so I do not use the tool right now, but follow along and try to learn it, in case I do want to attempt position trading in the future
Hey Clint,
You have always helped me out with the time issues, so maybe I can help you with my COT understanding. I believe what you are doing is seeing the large speculators increasing their positions while price is going up, and thus making a correlation between price and large specs. Follow the large specs, and you’ll be on the right side of the price move, right? That is half of the story, but not the whole of it.
Large specs are mostly made up of funds, and they are just huge pools of managed money that, by and large, follow the trend. They use MAs to get in and out of the market, and the more advanced a trend is, the more longs they have on. They don’t know when the trend will end, but they are married to the concept of trend which is why they have larger positions on the nearer the trend is to ending (‘this isn’t a trend, this might be a trend, I think we have a trend, yes this is a trend, oh boy what a trend’). By the time they have got their dumb heads around the fact that we are in a trend, and they have acted on it, the trend is all but over!
I think it is probably this concept that is difficult to get your head around. The upward move in OI on the large specs when price is going long indicates that they are unsure of the new trend at the start (hence a small long position), but convinced of the trend at the very end (hence a large long position). If they were ‘smart money’, don’t you think they would have a long position on at the start, and then gradually reduce this position as price went up (which is what the real smart money - the commercials - do!) ???
In another way…the large specs are most confident that price will continue to go up at the point when it is least likely to go any further! They are least sure of themselves at the point where price has turned and has plenty of room to rise.
I hope this makes sense.
Kind regards
Ali
yea i guess im still a little off on using the COT myself…i definitely see that the comm is at a one year high now, but compared to the last 3 years it doesnt seem like much…i think in the videos ICT was saying about watching for explosive moves when they are at very very high levels, and watch for regular trade bias to be long (or short) if they are at a one year extreme??

I’m not Michael but I believe he said that he uses COT for his positioning for the long term trading.
I just thought if anybody could point out how wrong/correct my analysis for this week; I appreciate that so much. I use pivot, fib. retracement, price action, and COT. I believe this week will be crucial to the market since it may reverse the market flow. (I’m sorry if I’m repeating what ICT has said since I just missed the webinar. I’m not sure what he said)
But anyway, here is the link. And if this is way beyond point of this thread, I’ll remove this post. But I appreciate if you could see. How to trade this week and trade#33 | MeetPips.com
Have a good trade 
I believe the 3 year extreme placed in May 2010 has been creating a bullish bias for well over a year now. That was quite clearly the bottom of the market, and the swing highs you have seen since then can be seen in the one year extremes in the COT data.
When you say that ‘comm is at a one year high [B]now’[/B], I think you mean ‘comm was at a one year high on [B]July 12th[/B], and has now pulled back from that’. Be careful how you read these charts - you would be amazed at how people are keying off this data as soon as they get their grubby mitts on it!
Try looking at one year extremes in the Commercial data AND the non-commercial data, taking the date from which the data comes (the Tuesday), and adding 6 days (data is released on the Friday, day 3, but we can’t take action until Monday, day 6). There are some wonderful wonderful entries over the years, not least this one on July 18th (July 12 +6 days) 
GLGT!
Ali
Yes sir your right I meant back in july (doh!) That’s what I get for posting in a hurry…but im still wondering if im right about remembering the whole " yearly highs and lows will give a general “now” bias while 3 year high lows will give the explosive moves?
If by ‘explosive moves’ you mean long term position trades, then yes, I believe you are correct. The yearly highs and lows will give smaller bias within the longer term bias.
Yep I luv it when a plan comes together.
LongTermHigh was put in at late April. (LTH)
Blue boxes showing some ShortTermLows. (STL)
Purple boxes showing IntermediateTermLows. (ITL)
Red box is the almost (98% sure) LongTermLow. (LTL) I’m being iffy because on some platforms/feeds that show Sunday as a seperate bar, the LTL has already completed but on Alpari it hasn’t which is the last blue box STL on the pic.
Should now be biasing to the long side of things and start trading off the lows and treating every high as part of a new structure finishing at a LTH. Warning Nothing is perfect and it could still fall through the floor.
There is nothing to say a new LTH will form above the old one, this in it’s self should tell us something useful but it is looking good to go higher IMHO.
Market Stucture, I think, is best done on the higher time frames, 1h is proberly the lowest to go to (trying to do MS on a 5m chart will sent you screaming from the room very quickly). Like all indicators MS will fail but IMO it poos all over market flow for bias and the only flow I take notice of these days are the 4h.
Wally
Wally, I like your style. I only use market flow as an indicator for exits (if MF is in my trade direction, I can feel more confident in aiming for higher fib extensions). Market structure is truly where it’s at.
Michael (ICT), in an earlier video (one of the February ICT Pro Trade Review videos), you had shown an example where you set the ShiftHours of the PivotDailyMacro to NY EST (-5) as opposed to GMT (0). This past weekend - during the webinar - if I understood you correctly, I think you mentioned you don’t change the ShiftHours when trading – that is, you leave it at 0 (GMT Pivots). I’m struggling to grasp when/if it’s beneficial (during which sessions/time of day if applicable) to change the ShiftHours of the PivotDailyMacro (I am also on the East Coast of the US if that matters at all). Thanks!