What Every New & Or Aspiring Forex Trader... Still Wants To Know

Ali, thanks for your reply. You have given a very detailed and logical explanation of a complicated topic. I appreciate the time and effort you put into your reply.

I still have some questions:

Since the graph of open interest for the commercials is essentially the [I]mirror-image[/I] of the graph of open interest for the large specs, what difference does it make which one is watched? Are you saying that commercial open interest [I]anticipates[/I] market turns, and large spec open interest [I]reacts[/I] to market turns?

Also, COT data for currencies is [I]futures data[/I], not spot forex data, is it not?

Finally, you described who the large specs are, as well as how they track the market — basically as trend-followers. But, who are the commercials? And how can they survive, doing what they seem to be doing — which is, persistently [I]shorting a rising market[/I], and persistently [I]buying a falling market?[/I] Nobody else can do that without getting slaughtered.

Clint - here’s some basic data on COT and the 3 different players; the comm’s are industry types who need to hedge volatility in the commodity they produce - or something like that…

Understanding the Three Groups | Market Sentiment | Learn Forex Trading

there’s also a link out there on some other trading forum website that you can DL a whole book dedicated to reading the COT data… if i can find the links i’ll post them but they’re the Commitment of traders bible and Secrets of the COT report - 300 and 200 pages long respectively… i’ll keep them for my summer hols… ha ha…

The example that ICT gave us that made things easy to understand for me, was when he said that when in daily TF, and there’s a range formed, then you can look to COT data to see which way the range will break out from. So if you look at EU day chart for early May 2011 there was long up trend and early May was a range formed, then look at your COT data and the comms are at an extreme short, and the large specs are at an extreme long - then you know that the range will break down wards.

but… you don’t just sell once you notice that, you look for a turtle soup fake out of the top of the range, as he did, or an OTE or some other type of entry to get you a good fill on an intra-day trade that will hopefully turn into your position trade… Thats what i took from ICT’s lesson…

Whats the trader’s trinity? For us that didnt watch the webinar, there’s a mysterious trinity that we have no idea what you lot are talking about - ha ha…

Went short GU today, LO trade, actually got in before an OTE formed, just noticed a pin bar form right on the key S/R line i drew on weeks before showing a retest and rejection of that level, that with the 4 consecutive bull days on GU - figured it time for bear day… and… just got stopped out for -10 pips (moved my SL down to just above swing high…) wow LO are tough… wait to see what NYO tells me… Looks like I tightened up my SL too early and didnt give the market room to play around in… ??? we’ll see.

WHATS THE TRADERS TRINITY?!?!?

GLGT!

In answer to your questions, Clint…

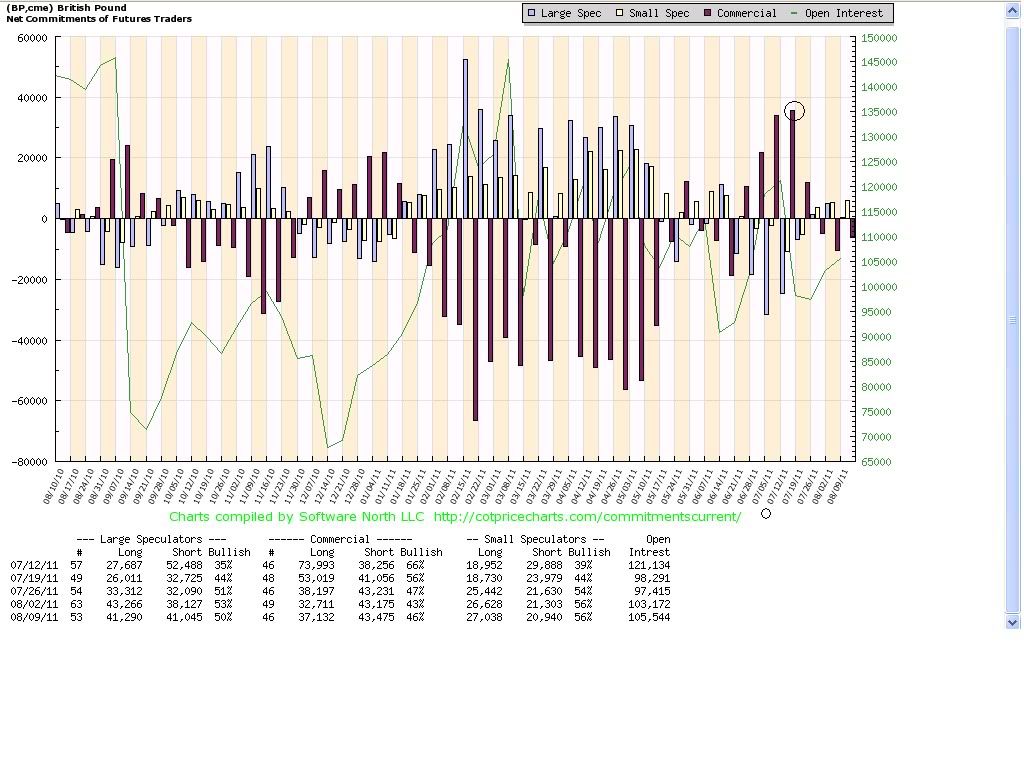
[B]Since the graph of open interest for the commercials is essentially the [I]mirror-image[/I] of the graph of open interest for the large specs, what difference does it make which one is watched? Are you saying that commercial open interest [I]anticipates[/I] market turns, and large spec open interest [I]reacts[/I] to market turns?[/B]

The markets were set up by the Commercials in order to facilitate business. The Non-commercials are exactly what their other name suggests, speculators. It would make sense that we are more concerned with the ones that actually created the markets, although I accept that they are a mirror image, and there may not be a difference in which one you watch (I say ‘may’, because I am just following Williams, and what Williams does seems to work for me - I don’t have the time to find out what ‘also’ works!)

In answer to your second question, yes, Commercials ‘anticipate’ and Non-commercials ‘react’.

[B]Also, COT data for currencies is [I]futures data[/I], not spot forex data, is it not?[/B]

I believe COT data released on a Friday is the sum of all Futures contracts that are currently active.

[B]Finally, you described who the large specs are, as well as how they track the market — basically as trend-followers. But, who are the commercials? And how can they survive, doing what they seem to be doing — which is, persistently [I]shorting a rising market[/I], and persistently [I]buying a falling market?[/I] [/B]

You should try and pin Michael down on this one, but I believe the Commercials are all entities that are hedging their risk. This may be the banks, or it may be large multi-national companies such as Boeing and Airbus who sell a lot of their products outside of the geographical location where they are based. These people know how the economy is fairing before the funds do, and they want to offset their currency exposure by taking the opposite side of the trade. When you say ‘shorting a rising market’, and ‘buying a falling market’, it implies that they are ‘reacting’ to what another entity is doing, which would make them the ‘dumb money’. My take on it is that even though they seem to be doing the exact opposite of what price is doing, they are the ones that know first what price will do! Does that make any sense?

Regards
Ali

Here in a nutshell is what Ali is explaining to Clint for those of you who like visual aid.
26th April, Commercials are extremely NET SHORT (Even though this is not their largest net short position in over a year, you still need to be paying attention to levels like this)

12th July Commercials are extremely NET LONG, This is their largest net LONG position in over a year.

Now Look at the chart below and look how price made a high at the end of APRIL (LONG TERM HIGH)
Look at how price turned on the 12th July and as Wally was saying “98% chance this will be a LONG TERM LOW”

At the same time the commercials where NET LONG, The non commercials (Large Speculators), where net short and visa versa. This is because as Ali was saying, Non commercials are trend followers.

Hope this helps

For those who like the Traders Trinity, well this concept is very similar. There are overbought areas and oversold areas which, just like TT, signal you should be paying attention. The best signals come when the Commercials are making new ground for the year, but even if they are still 25% off that new ground, you should be paying attention. If other confluences dovetail with the Commercials while they are still short of new ground, you still have a good set up.

Don’t sweat it too much just use one or the other, you’ll find there’s not much difference between them.
My rule of thumb is use GMT to be close to Asia zone and for the begining of the week and -5 EST for tuesday onwards and the other zones eg. London, NY, LC.

Wally

So I missed a trigger, the Turtle Soup pattern. Has ICT gone over this yet?
If he has, I missed it, could someone either explain or tell me where I can find where ICT went over it?

Could anyone please explain the difference between the Daily pivot macro and daily shifted pivots? Also how do i retrieve the midpivots?

Hey there,

took a loser on EU short as I went in for an OTE after the bounce, but it shot up to the recent high just to drop down 90 pips afterwards, didn’t think that PA would be able to make such huge moves during LC KillZone! Made a perfect bounce of that high, showing that EU isn’t able to make higher highs or trade higher. Then I took a look at GU and what did I see there? It’s trading up to last years high, a pretty important key resistance, which has been tested two times this year! SMT divergence and last year’s high? I’d say that there’s a high probabilty setup for a short on GU forming and I’d really like to catch that one. In this case I’ll draw the fib from the bounce to the support where it will retrace.

On the other side of this analysis is the inverted head and shoulders pattern on the daily and this resistance is the neckline of it. If it breaks we could see a nice upward move in the distance of neckline to shoulder, so I’d target 300 pips on this trade. This could be a new Long Term High, which is targeted from the Long Term Low - remember, price is trading form LTL to LTH. Ofcoure this could take sometime, but it’s a high reward trade for me. The second case for the fib is the last fractal that has formed on the swing that broke through the resistance to the high where it retraces. Hopefully the old resistance turns out to be the new support in the OTE Zone!

It doesn’t matter to me what happens, these are the two setups I’m currently watching and I’m trying to stay patient and wait for them to unfold in an OTE. I’m prepared for it! But personally I tend more to the short option. I know that this isn’t thaught by ICT, but the volume on the upmove to the resistance is decreasing significantly on the daily chart. Plus the SMT divergence!

As usual thoughts/comments/critism is very welcome :slight_smile:

greetings

PS: Here’s an interesting picture of yesterdays NYO trade - notice how price reacts at the 50% Fib? Then Booom! takes off with an OTE in NYO :slight_smile: (This Fib is from LWH to LWL)

Uploaded with ImageShack.us

EDIT: Just watched the Webinar - nevermind my discovery of the fib action ^^
let’s put another EDIT in here :slight_smile: If you look at the last webinar at the end of the video Michael shows a drawn move on a pic. Look at this one and then switch on your GU 15m chart - where’s the difference? Just the TimeZone, he refers to LC but the exact same setup as shown on this pic has actually occured in NYC. Even the SMT divergence as I mentioned above.

Anyone else catch this entry on GBP/USD? Looked like MF was bullish so decided to look for a long. Around NYO this started to unfold. Entry at around 1.6348 (Confluence of OTE, today’s central Pivot, close to 1.635 number). My fib was marked from the ADR low of today to recent swing high (which was also R2 of yesterday). Stop loss was just below today’s ADR at 1.6318 (so still within the 30 pip stop loss risk). Partial profit at 30 pips, partial at yesterday’s high, and full profit at confluence of today’s R1 pivot, 1.6420 institutional level, and slightly north of 127.2% fib level.


I watched that unfold and was focused on the fiber for some reason, so I didn’t take action. Kinda kicking myself now.

I was afraid of trading in that zone because it was juuuust above the ‘bad zone’ that ICT was talking about, and I promised myself to be ‘high probability trade’ this week. Though, clearly, that trade you did had a probability of “exactly correct” it appears!

Even when price got well above daily R1 pivot I was shy of it, finally entering a short just after price poked the weekly high. Yes, shorting, even when h1, h4, daily, weekly, monthly all pointing up! I’m about 20 pips profit so far, but leave it to me to botch it later (we shall see).

Edited some hours later to add: this one’s a winner… just not sure how big yet. I’m so glad I learned a plan to scale out and adjust stoploss sanely. Sticking to that has sure cured the ‘turning otherwise hugely profitable trades into losses’ syndrome…

Nice trade sladha, using the tools like that is all you need to make money in FX :13:

Soooo typically me with 3 losers this week. Way too keen to use the trinity trading bias, I learnt it Sunday so I’ve [U]got[/U] to use it Monday!!

Just reading the 25 rules of trading discipline and to paraphrase, “if you are a disciplined trader 9 out of 10 times, don’t consider yourself a disiplined trader. That 1 time with cost you plenty.” This=me.

Great COT discussion guys it’s been a great help thanks.

One other factor that applies to Commercials but not Specs, is that the Commercials make their money outside of forex - in the real world. Exchange rates are a risk to them, which they hedge. They may “win” or “lose” on their forex position, but that doesn’t really matter as they make their money from whatever deal they are hedging.

Hey folks, I just realized I never posted a heads up on the webinar… the link is found on the first page of this thread… click ICT Pro Trade Review 08/14/11

[B]GLGT [/B]:57:

Exactly! But here is a spanner to put in the works…if Commercials are continuously hedging as we have suggested, why does price rise when they cover their shorts? (This is indicated in the 20% drop in OI on the futures contracts.) Surely if they expect vastly higher prices, they would be increasing their shorts in order to counteract the expected move up? I have been over and over this in my mind, but I just can’t get a handle on the logic. The first part - the stuff I explained to Clint - I am happy with, but this I just can’t get my head around.

Regardless, all of the signals DO work. That is a given. If anyone has a new take on this latest contradictory twist, then please speak up!

Thanks. Not to draw this out, but I’m still confused. I think it’s a matter of understanding the concept behind what ShiftHrs do and how to properly apply them. I’ve noticed at times where ShiftHrs = 0 will give confluence with a particular level, thereby aiding in a particular trade strategy. At other times, I’ve noticed instances where ShiftHrs = -4 (NY pivots) aid in trade strategies by providing various confluences/S&R levels. Surely there must be an ideal time when to apply one over the other. Still looking for some more clarity… thank you

Hey PipBit, I’m a huge fan of your trader’s trinity indicator…would it be possible for you to write a monthly version of the tool? :smiley:

I got ICT in the chat, hinting at the use of TT on monthly High/Low :wink:

Hello again,

I would appreciate some help clarifying the use of US Treasury bond yield rates.

When these yields go up, we would expect GBP/USD (for example) to go down, as traders convert to USD in order to take out bonds. I am not sure, however, how fast this effect would take place. Does anyone know?

Yet, increased risk aversion would drive down [I]both [/I]the GBP/USD [I]and [/I] bond yields, wouldn’t it?

Thirdly, and most specifically, how do failure swings in the bond yields actually predict changes in GBP/USD? The answer I am looking for here is something of the type IF…THEN…ELSE rather than just a discourse, though the discourse would be useful too, particularly if it can give reasons for both changes and how they are related.