What Every New & Or Aspiring Forex Trader... Still Wants To Know

The templates include NY session trading :wink:

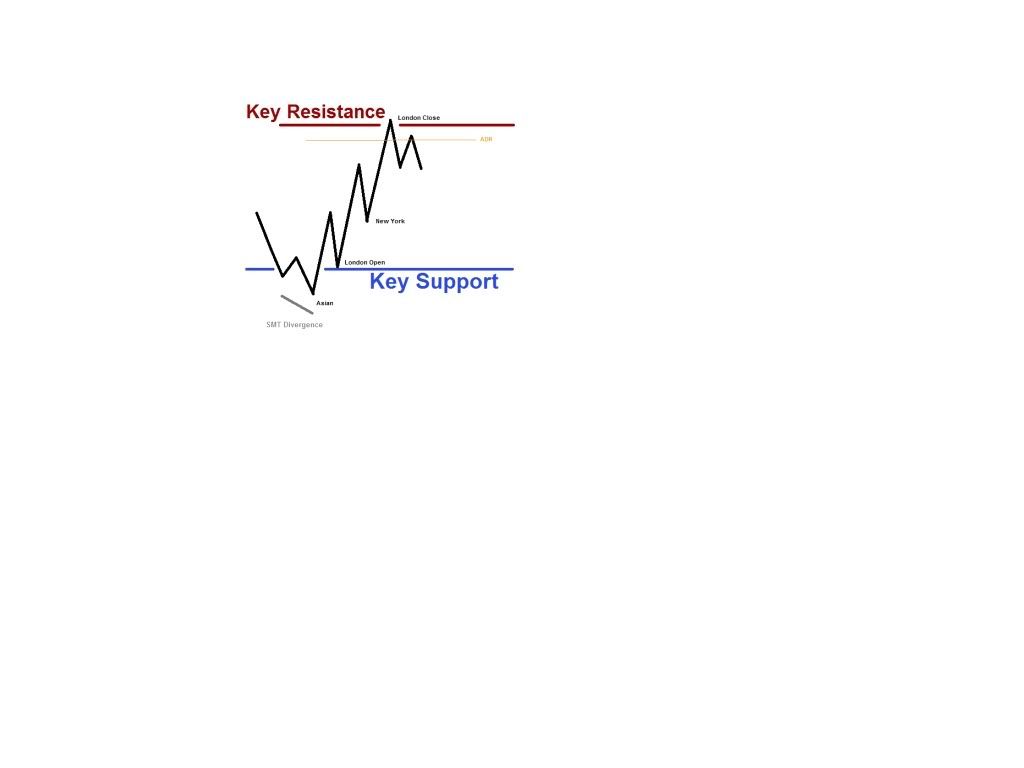
How do we trade NY session on a ā€œbuy dayā€ template
If NY opens lower than London session high, expect price to retest the high made in London

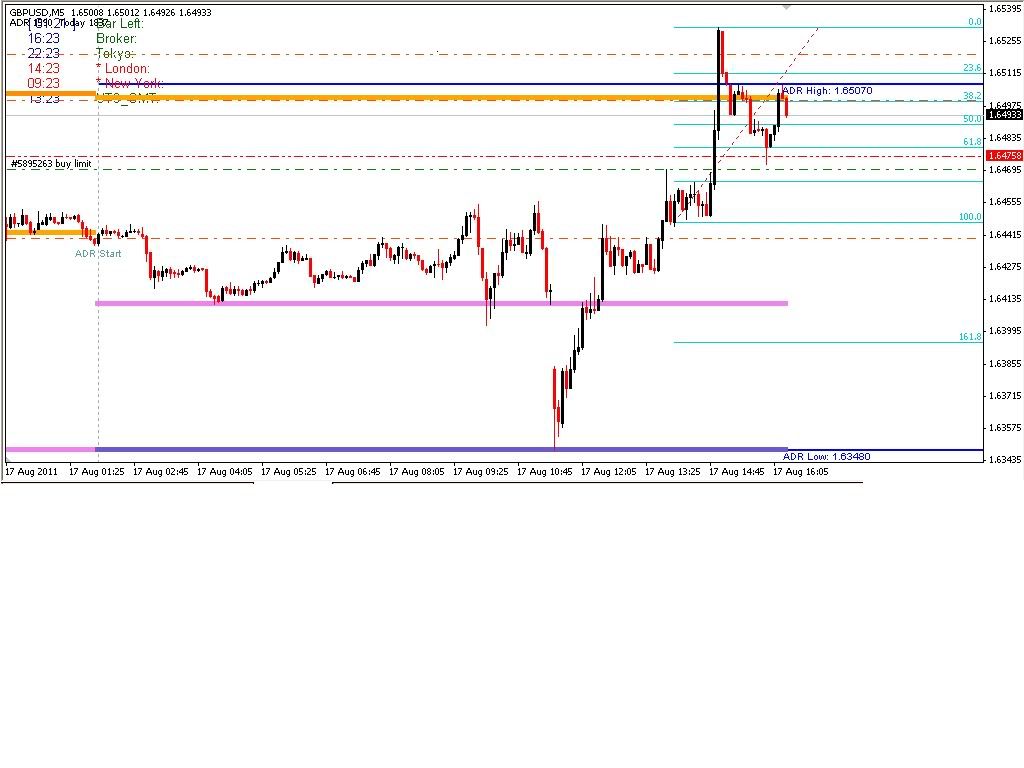
The chart below shows my orders that were unfilled (missed by 2 pips)
If you look at the buy day template, you can easily see yesterdays price action was in agreement with the template

I am afraid I am still stuck on how to use the US treasury bond yields as a predictor for GBP/USD.

Hereā€™s the first stumbling block: the bond-related posts on this thread talk about watching the yield rates, yet what Michael showed in the video that covered this subject were not the yield rates at all, but percentage changes in yield rates (on charts from stockcharts.com and bloomberg.com). Itā€™s easy to confuse the two things, but I can see that there can very plausibly be highs and lows in the rate of yield change that are not matched by highs and lows in the yield itself. He accesses Esignal data, which I do not have access to, so I am unable to ascertain whether in practice heā€™s seeing the same curves (albeit on an intraday basis). So what is the data that ought to be used: yield rates, or change in yield rates?

Secondly, which yields should be compared? The chief candidates appear to be 2, 5, and 10 years, but I seem to remember both 1 and 30 year yields being mentioned too.

Third, how reactive or sluggish is GBP/USD to respond to yield patterns perceived at a daily rate?

And, say the rule is as I interpret Autodidactā€™s notes:
IF
yields are falling
ANDIF
one yield fails to make a lower low
THEN
GBP/USD will fall //(USD will rise)
ORIF
yields are rising
ANDIF
one yield fails to make a higher high
THEN
GBP/USD will rise //(USD will fall)
ENDIF
But this still begs the question of what does it mean if two or more yields fail?

Lastly, there is the general question of what is holding all this together? As I mentioned, weā€™ve recently had a very graphic lesson that when risk tolerance falls, the yields can drop in concert with the GBP/USD, which would seem to wipe out the rule completely.

Sorry if all this is complicating something that is really very simple, but I fundamentally do not understand it.

Hello Pajo,

The chart I posted is the one that ICT pointed us to in the early lessons, so I figured if the boss says thats what to use, then it would work fineā€¦

Donā€™t know if the chart shows the rates of change or rather that all the yields are rebased to zero to make them comparable.

I think with this tool, as with other tools where youā€™re looking for divergence - MACD, SMT, etc - its just a case of following all the correlated pairs/bonds yields, in their trend and waiting for one to fail at making a subsequent new high/low - indicating weakness in the trend. Or wait for one of them to act differently to the other at a significant level - previous swing highs, S/R etc.

As for this bond yield SMT specifically, looking back now - it does seem to catch some of the major swings on the daily chartā€¦ even just looking for the yields highs to be tested and looking for failure highs there in one of the bonds yields would of indicated a move down in the USDX. The longer term bonds seem less volatile so its only clear on the near-term dated bondsā€¦ but the highs of the yields would of caught the USDX daily swing high on 14 Feb - the yields made a failure high on the 10th Feb - so they give you a couple of days notice which is niceā€¦ and againā€¦ onā€¦ 10th March was a USDX swing high while the yields had failed to go higher on the 8th Feb - 2 days noticeā€¦

Those rules look about right i guess - its just the same for any divergence, and actually looking back at it all now - its pretty amazing, signif highs have by and large called signif highs in the USDX, and thus signif lows in teh EUā€¦

Again - cheers ICT!

Hi Alishijo!

what do you mean: " the overall COT bias is pointing higher"?

Cheers,

Auto.

Hi guys just wanted to share this trade yesterday in LO.

Confluence of mid pivot + previous resistance + .50 figure + OTE. It was helped in the end by news but before the news it made a nice swing down which I thought might be the ā€œsmart moneyā€ getting in. Might just be pot luck in the end!

You could have also gone long which a few guys have showed as there was a near perfect OTE going long after price was smashed.

Entered 1.6450 Exited 1.6400

+50 pips.

Hi Shaunn i was thinking more of august 16. Range not filled, some SMT, some implied support, good recipe for a pie, still would like something more printable like the one in the webinar.

I take my bias from the last intermediate term COT set ups that I witness - the last one being July 12th. Until I see a set up in the opposite direction, I am looking for longs.

Autodidact,
Thanks for persevering with this. I took in what you said, about the lag, and unimportance about which yield failed, etc, and I persevered with this in turn, using the normalised yield data, PerfCharts - StockCharts.com - Free Charts

Hereā€™s what I distilled so far in 2011:

[B]Jan 24: failure high on the 5Y - Jan 25 daily swing high AND swing low in a general up trend[/B]

CORRECT direction, but hard to evaluate, as GBP/USD was rising anyway

[B]Feb 10: failure high on the 2Y - Feb 11 daily swing low following a 6-day down trend with a 6-day up trend[/B]

CORRECT direction.

[B]May 9: failure low on the 30Y - May 11 daily swing high in a general down trend[/B]

CORRECT direction, but hard to evaluate, as GBP/USD was falling anyway

[B]Jun 3: failure low on the 10Y and 30Y - Jun 7 daily swing high AND swing low starting a down trend until Jun 28[/B]

CORRECT direction.

So overall, that is an endorsement of the data and rule as a leading indicator of GBP/USD price movement. I think I understand it now. For posterity, hereā€™s a modified version of the rule:

IF
rates of change in 2, 5, 10 or 30-year US treasury bond yields are all falling
ANDIF
any one fails to make a lower low when the others do
THEN
GBP/USD will fall about 1-2 trading days later
ORIF
rates of change in 2, 5, 10 and 30-year US treasury bond yields are all rising
ANDIF
any one fails to make a higher high when the others do
THEN
GBP/USD will rise about 1-2 trading days later
ENDIF

In light of this weeks events and trading, I have revised my trading rules to be more strict. I have printed this list out and will go over it before every session. It is taped to my fridge. If I follow this rules list I will be more profitable than I ever dreamed possible. If I do not, I will have weeks like this week or worseā€¦ This week I am currently down -2% (EDIT: Ended week with +0.8%) and I know exactly why. If you guys are interested in why, my full blog post can be found on my meet pips blog (link in my profile). It is a heart breaking read, as it was writing it, but a necessary analysis. Trading plan outlined and revised, I hope this helps others as well struggling to come up with some rules, but I have to emphasize make sure they work for u dont try to follow anotherā€™s play by play it will end in disaster. Rules have to fit your personality, these work for me, now I just need to follow them.

Read This Every Trading Session

  1. What is the daily time frame market flow?

  2. What does the trinity chart look like?

  3. Check if there is divergence on the Smart Money Tool if you have a clear daily market flow bias.

Lower Lows, Higher Lows Divergence = UP, take the lower lows currency.

Lower Highs Higher Highs Divergence = DOWN, take the higher highs currency

  1. 1% risk of account for scalps and higher risk trades, 2% risk with the daily trend and confluent factor trades.

  2. Stop trading for the day at <4% account gain for the day

  3. Swing trades exit strategy:

-30-50% out at 30 pips, move stop to BE

-20-40% out at 100% fib extension

-10-30% At major S&R, extensions Pivot Points, ADR or at 90-100 Pips

  1. NO REVENGE TRADING

  2. NEVER risk more than 2% on any one trade

  3. Trade ONE pair at a time

  4. Asian session scalps for 15-30 pips MAX

  5. Asian session is only traded if I am home and not doing anything, this is a bonus session. It is also only traded if a clear range has formed for the Tokyo open at 7PM EST. Trades start after 7PM.

  6. Do not chase price

  7. Donā€™t be greedy. Stick to entry rules. Stick to exit rules.

  8. Donā€™t listen to anyone else on your trade entries or market analysis

  9. Asian Session and USUALLY London Close trades are risk MAX 1%.

  10. If LO is taken, and profit is gained with greater than a 1:1RR, so risking 1% or risking 2% if that percentage is gained then NYO is not looked at - its time to sleep in. No sense in giving it back to the NYO if you get itā€¦

In this case London Close are taken with 1% MAX (scalps should always be 1%, IE Asian Session) and they are also heavily monitored and are not taken unless there is a really really good confluence.

  1. London Close is only taken if the ADR for the day has been breached and we are trading above/below it

Nice list Zneve, wish you luck in sticking to it. One point Iā€™d like to bring up - you mention ā€œWhat is the daily time frame market flow?ā€ If this suits you, thatā€™s great. However, Iā€™ve noted in multiple instances where ICT gives significant importance to the 4 HR time frame, and even mentions it as the ā€œbellwhetherā€. Iā€™d also incorporate a checklist item highlighting whether any significant S&R levels exist that may trump market flow. You seem to have it pretty much covered though, good job.

Hi, can anyone tell me how the ICT_ADR indicator computes the high and the low? Thanks.

I donā€™t follow. The template is for the full trading day?

Hereā€™s the template for a"Buy Day"

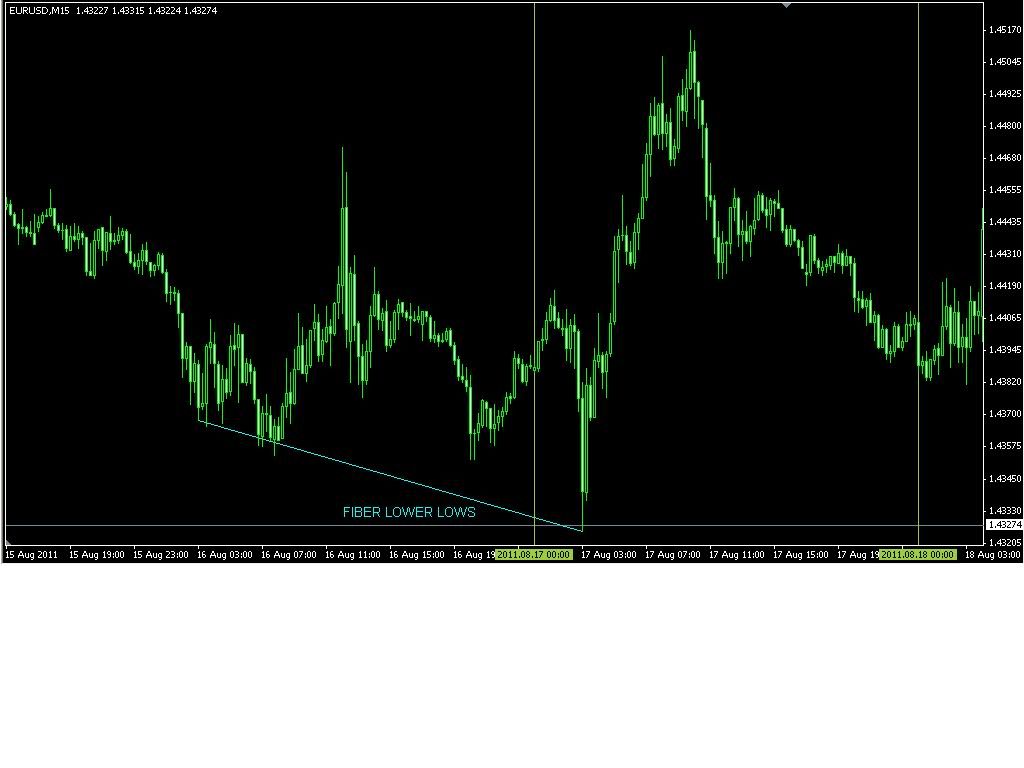
Fiber Lower Lows at London open

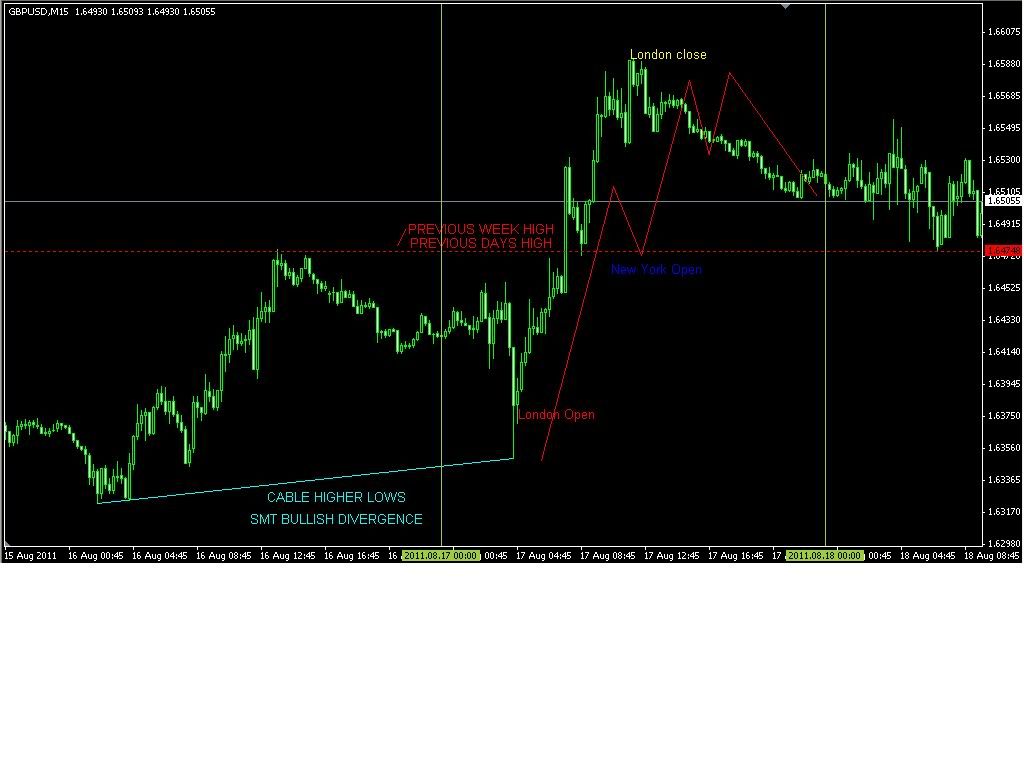
Cable Higher lows at London open, theres your SMT screaming buy me! You have OTE(FIB 16th low to 16th high), institutional level 6350, 2 weeks prior equilibrium level on traders trinity andā€¦ and ā€¦andā€¦

Then if you missed that you had a chance to get in on the action during New York Open as per my trade i mentioned above that was missed by 2 pips (maybe not as strong as LO trade but still a nice trade)

Hope this helps your understanding of the templates

Here it is :slight_smile:

Uploaded with ImageShack.us

I think the pic explains everything :slight_smile: There were some great oppurtunities yesterday and today during NYO & LO, Iā€™m really sad that I couldnā€™t take any of it ;/

Hereā€™s something I watch for NYC. EU has broken itā€™s bullish trendline, but GU made a clear bounce of it and is making higher lows, so Iā€™m quite unsure if Iā€™m watching this correctly! ;S

Uploaded with ImageShack.us

[QUOTE=Zneve

  1. Check if there is divergence on the Smart Money Tool if you have a clear daily market flow bias.

Lower Lows, Higher Lows Divergence = UP, take the lower lows currency.

Lower Highs Higher Highs Divergence = DOWN, take the higher highs currency

[/QUOTE]

Zneve, good list you have here, and thanks for posting this tidbit on SMT, I have always struggled with it.

looks much more convincing on the 5min chart than it does on the 15min chart (which is the one I was eyeing). Now I see it. Looks like it was just around or slightly less than a 30 pip swing from the swing high to the swing low you pulled your fib on, and on the 15min chart itā€™s basically measuring the high from the first candle to the low of the very next candle, which is definitely something I wouldnā€™t have pulled a trade on. Had I have seen it on the 5min. chart, however, I just might have. I need to start looking at my 5min. chart a bit more I guess, but congrats on squeezing some pips out on that one.

my NYO trade. This was a 50% retrace entry. I was digging the confluence at that level better than the OTE level, and took it how I saw it. Lil orange arrow is my entry (3 x 6600 units), and the blue dots are my T/P, each 6600 units.

all T/P orders were placed at the opening of the trade, and I turned off the charts (had to go to work) immediately after my order got filled. Trade management is my weakness because I have to work, but I try to make doā€¦

Hope everyone is still looking at USD Index for their top town analysis. Yesterdayā€™s short move keyed off a 50% retracement which lined up with previous spikes down on Aug 15th and 16th. This was the formation of a STL which created an ITL at 73.44 (H4 charts). Moving over to GU you can see that it had hit resistance on the daily after 4 days trading over the CPP. That classifies a strong move up that is ripe for reversal IMHO. Entry came at LO with MR1 coinciding with 62% retracement and the 1.6550 level. Price chopped around through London morning session but finally came down to 162 extension during NY morning. It is good to have a bias, but donā€™t marry yourself to the bias if you see a good opportunity for a pullback!

GLGT!

So we have covered ā€˜producersā€™ who are hedging their currency risks, but to make a reasonable argument for the banks I think it is worthwhile considering how these commercial producers operate as ā€˜commercialsā€™ in their own marketsā€¦

If a commercial entity is making chocolate bars and the price of sugar and cocoa continues dropping, the commercials will buy more of these items as prices go lower because the net cost of making the candy bar, to them as a producer, is lower.

If we look at someone like BHP, they probably have a great deal of gold, silver, coal etc on hand, and so as prices rally, they will sell off this inventory. The confusion here is that they are seen as selling short, when in fact they are just selling inventory.

If this assumption is correct, then we have to also assume that commercials in the currency markets act in a similar fashion. The commercials are generally the banks, and the banks deal in money! They donā€™t ā€˜produceā€™ this money using raw ingredients, and they donā€™t dig this money out of the ground, but the markets were set up by the banks for the banks, and they hold all of the inventory. If the large specs are willing to take more and more of this money off the banks hands as price goes higher (as they only trust a maturing trend), why wouldnā€™t the banks let them do so!

My understanding is that the banks make money from transaction costs, and from pairing orders. In this respect they are not thinking about ā€˜winā€™ or ā€˜loseā€™, more about supplying liquidity. To pair these orders they need to push prices higher in order to take them lower, and this is why ā€˜raiding the stopsā€™ and OTE work so effectively. We are merely jumping on the back of the banks, and picking the pockets of the large specs. The ā€˜smart moneyā€™ i.e. the banks, can see exactly where these SLs are placed. We canā€™t see that, but with the help of ICT teachings we can know what the commercials are thinking by looking at Price Action. It is pure and simple, and downright genius! Of course, there are innumerable things out there that are also influencing the markets, and so when we canā€™t see the clear hand of the banks, we STAY OUT!

I hope somebody will speak up if my train of thought does not compute, or they have a different take on it. Iā€™ve done my homework, and I know my signalsā€¦Iā€™m just trying to fill in some of the ā€˜Why?ā€™ questions.

Regards
Ali

Some of you have requested to put my live a/c on forum. I am doing here.
I have learned money management from this thread and become profitable from the week I followed.
I may be overtrading so please follow ICT methods of trading only
Starting Balance: 36393
Ending Balance:38563
Profit: 2171
Open position: 1455 loss This is my long term position which gives me 12.50-13.00 interest per day so I will maintain this.
Idea is only 10 pips/day if more pips comeā€¦ I take it.
Thanks ICT again for webinarā€™s and risk management.

[B]Note[/B] Too many trades --> character limit reached so posting in next two replies. Any suggestion on overtrading welcome.

Date Transaction Pair Price Units Interest P/L Amount Balance
(USD)
August 14 09:56:57 2011 EDT Buy Order USD/JPY 76.287 100,000 * 36392.27
August 14 09:58:04 2011 EDT Buy Order USD/JPY 74.884 150,000 * 36392.27
August 14 09:58:15 2011 EDT Change Order USD/JPY 76.287 120,000 * 36392.27
August 14 09:58:54 2011 EDT Buy Market USD/JPY 76.749 100,000 0 36392.27
August 14 16:00:00 2011 EDT Interest USD 0.1496 0.1496 36392.42
August 14 16:00:00 2011 EDT Interest USD/INR 12.9607 12.9607 36405.38
August 14 16:00:00 2011 EDT Interest USD/JPY -0.2745 -0.2745 36405.11
August 14 17:44:59 2011 EDT Close Trade USD/JPY 76.843 100,000 -0.0798 122.216 122.1362 36527.24
August 14 18:38:50 2011 EDT Order Cancelled USD/JPY 76.287 120,000 0 0 36527.24
August 14 23:08:34 2011 EDT Sell Market AUD/USD 1.04059 100,000 0 36527.24
August 14 23:43:21 2011 EDT Close Trade AUD/USD 1.04056 100,000 -0.3305 3 2.6695 36529.91
August 15 02:14:11 2011 EDT Buy Market EUR/USD 1.43104 100,000 0 36529.91
August 15 02:15:00 2011 EDT Close Trade EUR/USD 1.43116 100,000 0.001 12 12.001 36541.91
August 15 02:59:27 2011 EDT Sell Market EUR/USD 1.42999 100,000 0 36541.91
August 15 02:59:50 2011 EDT Close Trade EUR/USD 1.42945 100,000 -0.0015 54 53.9985 36595.91
August 15 09:19:09 2011 EDT Buy Market EUR/AUD 1.37955 50,000 0 36595.91
August 15 09:20:28 2011 EDT Sell Order EUR/AUD 1.37567 50,000 * 36595.91
August 15 09:38:36 2011 EDT Change Order EUR/AUD 1.37187 50,000 * 36595.91
August 15 09:41:11 2011 EDT Buy Market EUR/USD 1.44142 100,000 0 36595.91
August 15 09:41:40 2011 EDT Close Trade EUR/USD 1.44152 100,000 0.0006 10 10.0006 36605.91
August 15 09:59:22 2011 EDT Close Trade EUR/AUD 1.37968 50,000 -0.2126 6.8006 6.588 36612.5
August 15 09:59:32 2011 EDT Order Cancelled EUR/AUD 1.37187 50,000 0 0 36612.5
August 15 10:16:38 2011 EDT Buy Market EUR/USD 1.44571 100,000 0 36612.5
August 15 10:17:09 2011 EDT Close Trade EUR/USD 1.44636 100,000 0.0006 65 65.0006 36677.5
August 15 10:28:19 2011 EDT Buy Market EUR/USD 1.4461 100,000 0 36677.5
August 15 10:28:41 2011 EDT Close Trade EUR/USD 1.44658 100,000 0.0005 48 48.0005 36725.5
August 15 11:19:52 2011 EDT Sell Market EUR/USD 1.4436 100,000 0 36725.5
August 15 11:21:08 2011 EDT Close Trade EUR/USD 1.4441 100,000 -0.005 -50 -50.005 36675.5
August 15 11:23:38 2011 EDT Buy Market EUR/CHF 1.12741 100,000 0 36675.5
August 15 11:24:35 2011 EDT Sell Order EUR/CHF 1.12387 50,000 * 36675.5
August 15 11:27:21 2011 EDT Close Trade EUR/CHF 1.12837 100,000 0.0056 122.9099 122.9155 36798.41
August 15 11:27:35 2011 EDT Order Cancelled EUR/CHF 1.12387 50,000 0 0 36798.41
August 15 14:03:10 2011 EDT Buy Market AUD/USD 1.04901 100,000 0 36798.41
August 15 14:15:07 2011 EDT Buy Market EUR/USD 1.44489 100,000 0 36798.41
August 15 14:24:31 2011 EDT Close Trade AUD/USD 1.0491 100,000 0.1619 9 9.1619 36807.57
August 15 14:24:34 2011 EDT Close Trade EUR/USD 1.44491 100,000 0.0117 2 2.0117 36809.59
August 15 14:29:00 2011 EDT Sell Market USD/CAD 0.98135 100,000 0 36809.59
August 15 15:15:57 2011 EDT Close Trade USD/CAD 0.9809 100,000 0.0134 45.8762 45.8896 36855.48
August 15 15:33:15 2011 EDT Buy Market AUD/USD 1.05051 100,000 0 36855.48
August 15 16:00:00 2011 EDT Interest USD 0.1504 0.1504 36855.63
August 15 16:00:00 2011 EDT Interest AUD/USD 0.2031 0.2031 36855.83
August 15 16:00:00 2011 EDT Interest USD/INR 13.1482 13.1482 36868.98
August 15 16:58:45 2011 EDT Close Trade AUD/USD 1.05045 100,000 0.4462 -6 -5.5538 36863.42
August 15 20:30:52 2011 EDT Buy Market AUD/USD 1.04777 100,000 0 36863.42
August 15 20:32:15 2011 EDT Close Trade AUD/USD 1.04814 100,000 0.0105 37 37.0105 36900.43
August 15 20:36:17 2011 EDT Buy Market AUD/USD 1.04807 100,000 0 36900.43
August 15 20:39:55 2011 EDT Close Trade AUD/USD 1.04831 100,000 0.0275 24 24.0275 36924.46
August 15 20:52:46 2011 EDT Buy Market EUR/USD 1.44406 100,000 0 36924.46
August 15 21:24:29 2011 EDT Close Trade EUR/USD 1.44348 100,000 0.0392 -58 -57.9608 36866.5
August 15 21:35:54 2011 EDT Buy Market AUD/JPY 80.442 100,000 0 36866.5
August 15 21:39:31 2011 EDT Close Trade AUD/JPY 80.487 100,000 0.0281 58.548 58.5761 36925.08
August 15 21:59:17 2011 EDT Sell Market AUD/USD 1.04861 100,000 0 36925.08
August 15 22:02:55 2011 EDT Close Trade AUD/USD 1.04974 100,000 -0.0348 -113 -113.0348 36812.04
August 15 23:15:03 2011 EDT Sell Market EUR/USD 1.44242 100,000 0 36812.04
August 15 23:21:36 2011 EDT Change Trade EUR/USD 1.44242 100,000 0 0 0 36812.04
August 15 23:22:11 2011 EDT Sell Order EUR/USD 1.44579 100,000 * 36812.04
August 16 00:39:23 2011 EDT Sell Market AUD/USD 1.0484 200,000 0 36812.04
August 16 00:52:15 2011 EDT Close Trade AUD/USD 1.04806 200,000 -0.2463 68 67.7537 36879.8
August 16 01:02:05 2011 EDT Close Trade EUR/USD 1.44239 100,000 -0.4259 3 2.5741 36882.37
August 16 01:02:16 2011 EDT Order Cancelled EUR/USD 1.44579 100,000 0 0 36882.37
August 16 01:06:35 2011 EDT Sell Market AUD/USD 1.0477 200,000 0 36882.37
August 16 01:22:33 2011 EDT Close Trade AUD/USD 1.04735 200,000 -0.3054 70 69.6946 36952.06
August 16 02:02:06 2011 EDT Sell Market NZD/USD 0.83204 100,000 0 36952.06
August 16 02:02:40 2011 EDT Sell Market AUD/USD 1.04617 100,000 0 36952.06
August 16 02:04:07 2011 EDT Change Trade NZD/USD 0.83204 100,000 0 0 0 36952.06
August 16 02:04:11 2011 EDT Change Trade AUD/USD 1.04617 100,000 0 0 0 36952.06
August 16 02:04:39 2011 EDT Buy Order NZD/USD 0.83646 100,000 * 36952.06
August 16 02:04:57 2011 EDT Buy Order AUD/USD 1.05074 100,000 * 36952.06
August 16 02:06:19 2011 EDT Order Cancelled AUD/USD 1.05074 100,000 0 0 36952.06
August 16 02:06:22 2011 EDT Order Cancelled NZD/USD 0.83646 100,000 0 0 36952.06
August 16 02:11:28 2011 EDT Close Trade AUD/USD 1.04566 100,000 -0.084 51 50.916 37002.98
August 16 02:11:36 2011 EDT Close Trade NZD/USD 0.83103 100,000 -0.0413 101 100.9587 37103.94
August 16 02:39:54 2011 EDT Sell Market EUR/USD 1.43875 100,000 0 37103.94
August 16 02:40:45 2011 EDT Close Trade EUR/USD 1.43815 100,000 -0.0034 60 59.9966 37163.94
August 16 03:02:32 2011 EDT Sell Market AUD/USD 1.04392 100,000 0 37163.94
August 16 03:03:56 2011 EDT Close Trade AUD/USD 1.0438 100,000 -0.0133 12 11.9867 37175.92
August 16 03:11:33 2011 EDT Sell Market EUR/USD 1.43699 100,000 0 37175.92
August 16 03:14:33 2011 EDT Close Trade EUR/USD 1.4369 100,000 -0.0119 9 8.9881 37184.91
August 16 07:46:42 2011 EDT Buy Market AUD/JPY 79.869 50,000 0 37184.91
August 16 07:57:47 2011 EDT Close Trade AUD/JPY 79.95 50,000 0.0429 52.7845 52.8274 37237.74
August 16 09:13:29 2011 EDT Buy Market EUR/USD 1.43926 50,000 0 37237.74
August 16 09:14:08 2011 EDT Change Trade EUR/USD 1.43926 50,000 0 0 0 37237.74
August 16 09:15:00 2011 EDT Sell Order EUR/USD 1.43526 50,000 * 37237.74
August 16 09:15:09 2011 EDT Change Order EUR/USD 1.43526 50,000 * 37237.74
August 16 09:15:51 2011 EDT Close Trade EUR/USD 1.43977 50,000 0.0015 25.5 25.5015 37263.24
August 16 09:15:58 2011 EDT Order Cancelled EUR/USD 1.43526 50,000 0 0 37263.24
August 16 09:42:10 2011 EDT Buy Market EUR/AUD 1.3752 50,000 0 37263.24
August 16 09:46:42 2011 EDT Close Trade EUR/AUD 1.37591 50,000 -0.0239 37.1145 37.0906 37300.33
August 16 10:26:12 2011 EDT Buy Market GBP/USD 1.63945 50,000 0 37300.33
August 16 10:28:34 2011 EDT Close Trade GBP/USD 1.64019 50,000 -0.0013 37 36.9987 37337.33
August 16 11:04:38 2011 EDT Buy Market AUD/USD 1.04833 100,000 0 37337.33
August 16 11:39:02 2011 EDT Sell Market AUD/USD 1.04823 50,000 0.1303 -5 -4.8697 37332.46
August 16 11:43:43 2011 EDT Close Trade AUD/USD 1.04852 50,000 0.1481 9.5 9.6481 37342.11
August 16 13:07:24 2011 EDT Buy Market AUD/USD 1.04219 50,000 0 37342.11
August 16 13:11:01 2011 EDT Close Trade AUD/USD 1.04228 50,000 0.0136 4.5 4.5136 37346.62
August 16 13:12:19 2011 EDT Buy Market USD/JPY 76.704 100,000 0 37346.62
August 16 13:41:56 2011 EDT Close Trade USD/JPY 76.741 100,000 -0.0225 48.2072 48.1847 37394.81
August 16 14:14:16 2011 EDT Buy Market AUD/USD 1.04741 100,000 0 37394.81
August 16 14:18:11 2011 EDT Buy Market EUR/AUD 1.37693 50,000 0 37394.81
August 16 14:25:07 2011 EDT Close Trade EUR/AUD 1.37717 50,000 -0.0366 12.5506 12.514 37407.32
August 16 14:41:17 2011 EDT Buy Order AUD/USD 1.04948 150,000 * 37407.32
August 16 15:05:41 2011 EDT Sell Market AUD/USD 1.04672 20,000 0.0778 -13.8 -13.7222 37393.6
August 16 15:29:51 2011 EDT Close Trade AUD/USD 1.04775 80,000 0.4581 27.2 27.6581 37421.26