August 16 15:29:58 2011 EDT Order Cancelled AUD/USD 1.04948 150,000 0 0 37421.26
August 16 16:00:00 2011 EDT Interest USD 0.1525 0.1525 37421.41
August 16 16:00:00 2011 EDT Interest USD/INR 13.12 13.12 37434.53
August 16 19:31:47 2011 EDT Buy Market USD/CAD 0.98348 100,000 0 37434.53
August 16 20:11:55 2011 EDT Sell Market USD/CAD 0.9836 50,000 -0.0439 6.0986 6.0547 37440.58
August 16 20:16:18 2011 EDT Sell Market EUR/USD 1.43581 50,000 0 37440.58
August 16 20:17:05 2011 EDT Change Trade EUR/USD 1.43581 50,000 0 0 0 37440.58
August 16 20:17:37 2011 EDT Buy Order EUR/USD 1.4388 50,000 * 37440.58
August 16 20:20:19 2011 EDT Close Trade EUR/USD 1.43572 50,000 -0.008 4.5 4.492 37445.07
August 16 20:20:27 2011 EDT Order Cancelled EUR/USD 1.4388 50,000 0 0 37445.07
August 16 21:03:51 2011 EDT Sell Market AUD/USD 1.0456 80,000 0 37445.07
August 16 21:16:35 2011 EDT Close Trade AUD/USD 1.04486 80,000 -0.0972 59.2 59.1028 37504.18
August 16 21:17:06 2011 EDT Close Trade USD/CAD 0.98353 50,000 -0.1152 2.5412 2.426 37506.6
August 16 23:18:08 2011 EDT Buy Market AUD/USD 1.04689 100,000 0 37506.6
August 16 23:25:40 2011 EDT Sell Order AUD/USD 1.04722 50,000 * 37506.6
August 16 23:27:28 2011 EDT Sell Order AUD/USD 1.0423 50,000 * 37506.6
August 16 23:27:37 2011 EDT Order Cancelled AUD/USD 1.04722 50,000 0 0 37506.6
August 16 23:29:20 2011 EDT Buy Market USD/JPY 76.685 100,000 0 37506.6
August 16 23:31:32 2011 EDT Sell Market AUD/USD 1.04608 50,000 0.0507 -40.5 -40.4493 37466.15
August 16 23:37:04 2011 EDT Close Trade AUD/USD 1.04578 50,000 0.0716 -55.5 -55.4284 37410.73
August 16 23:37:09 2011 EDT Order Cancelled AUD/USD 1.0423 50,000 0 0 37410.73
August 17 00:42:30 2011 EDT Buy Market AUD/JPY 80.419 200,000 0 37410.73
August 17 00:58:55 2011 EDT Close Trade USD/JPY 76.698 100,000 -0.0682 16.9472 16.879 37427.61
August 17 01:03:24 2011 EDT Close Trade AUD/JPY 80.49 200,000 0.3255 185.1031 185.4286 37613.03
August 17 02:05:26 2011 EDT Buy Market USD/JPY 76.625 100,000 0 37613.03
August 17 02:10:47 2011 EDT Close Trade USD/JPY 76.651 100,000 -0.0041 33.9164 33.9123 37646.95
August 17 02:59:26 2011 EDT Buy Market USD/CHF 0.79072 50,000 0 37646.95
August 17 03:30:00 2011 EDT Sell Market EUR/USD 1.43809 100,000 0 37646.95
August 17 03:31:16 2011 EDT Close Trade EUR/USD 1.43754 100,000 -0.005 55 54.995 37701.94
August 17 03:39:38 2011 EDT Close Trade USD/CHF 0.7894 50,000 -0.0153 -83.6078 -83.6231 37618.32
August 17 03:51:44 2011 EDT Buy Market AUD/USD 1.04926 200,000 0 37618.32
August 17 04:02:21 2011 EDT Close Trade AUD/USD 1.04935 200,000 0.1611 18 18.1611 37636.48
August 17 04:02:35 2011 EDT Buy Market AUD/USD 1.04982 50,000 0 37636.48
August 17 04:03:13 2011 EDT Close Trade AUD/USD 1.05019 50,000 0.0024 18.5 18.5024 37654.98
August 17 08:49:56 2011 EDT Buy Market USD/JPY 76.506 100,000 0 37654.98
August 17 09:48:09 2011 EDT Buy Order USD/CAD 0.97409 50,000 * 37654.98
August 17 10:55:51 2011 EDT Close Trade USD/JPY 76.581 100,000 -0.0957 97.924 97.8283 37752.81
August 17 13:52:49 2011 EDT Buy Market USD/JPY 76.462 100,000 0 37752.81
August 17 16:00:00 2011 EDT Interest USD 0.1545 0.1545 37752.96
August 17 16:00:00 2011 EDT Interest USD/INR 13.0885 13.0885 37766.05
August 17 16:00:00 2011 EDT Interest USD/JPY -0.0967 -0.0967 37765.96
August 17 16:13:55 2011 EDT Close Trade USD/JPY 76.495 100,000 -0.0106 43.1299 43.1193 37809.08
August 17 17:52:07 2011 EDT Sell Market AUD/USD 1.05361 100,000 0 37809.08
August 17 19:47:19 2011 EDT Buy Market AUD/USD 1.0557 50,000 -0.5554 -104.5 -105.0554 37704.02
August 17 20:08:12 2011 EDT Close Trade AUD/USD 1.05526 50,000 -0.6558 -82.5 -83.1558 37620.86
August 17 20:15:09 2011 EDT Buy Market EUR/AUD 1.36697 200,000 0 37620.86
August 17 20:19:28 2011 EDT Sell Market EUR/AUD 1.36731 50,000 -0.0228 17.9187 17.8959 37638.76
August 17 20:20:21 2011 EDT Sell Market EUR/AUD 1.36748 25,000 -0.0137 13.4376 13.4239 37652.18
August 17 20:27:42 2011 EDT Sell Market EUR/USD 1.44088 100,000 0 37652.18
August 17 20:30:10 2011 EDT Close Trade EUR/AUD 1.36752 125,000 -0.1981 72.4508 72.2527 37724.44
August 17 20:46:54 2011 EDT Sell Market AUD/USD 1.05313 50,000 0 37724.44
August 17 20:51:51 2011 EDT Buy Market EUR/USD 1.44091 25,000 -0.024 -0.75 -0.774 37723.66
August 17 21:13:06 2011 EDT Close Trade AUD/USD 1.05245 50,000 -0.1259 34 33.8741 37757.54
August 17 21:16:30 2011 EDT Close Trade EUR/USD 1.44006 75,000 -0.1454 61.5 61.3546 37818.89
August 17 21:21:51 2011 EDT Sell Market AUD/USD 1.05153 50,000 0 37818.89
August 17 21:28:27 2011 EDT Sell Market GBP/USD 1.65146 70,000 0 37818.89
August 17 21:38:23 2011 EDT Sell Market EUR/USD 1.44014 80,000 0 37818.89
August 17 21:40:46 2011 EDT Close Trade EUR/USD 1.43987 80,000 -0.0076 21.6 21.5924 37840.48
August 17 21:40:50 2011 EDT Close Trade AUD/USD 1.05058 50,000 -0.0911 47.5 47.4089 37887.89
August 17 21:53:51 2011 EDT Close Trade GBP/USD 1.65145 70,000 -0.0363 0.7 0.6637 37888.56
August 17 22:03:55 2011 EDT Sell Market AUD/USD 1.05065 50,000 0 37888.56
August 17 22:33:55 2011 EDT Close Trade AUD/USD 1.05117 50,000 -0.144 -26 -26.144 37862.41
August 17 22:58:47 2011 EDT Sell Market AUD/USD 1.05132 50,000 0 37862.41
August 17 23:16:36 2011 EDT Close Trade AUD/USD 1.05136 50,000 -0.0855 -2 -2.0855 37860.33
August 18 00:07:34 2011 EDT Sell Market AUD/USD 1.0503 100,000 0 37860.33
August 18 00:07:55 2011 EDT Close Trade AUD/USD 1.04963 100,000 -0.0034 67 66.9966 37927.32
August 18 00:10:42 2011 EDT Sell Market EUR/USD 1.43908 100,000 0 37927.32
August 18 00:14:09 2011 EDT Close Trade EUR/USD 1.43873 100,000 -0.0137 35 34.9863 37962.31
August 18 00:35:55 2011 EDT Buy Market AUD/USD 1.04944 50,000 0 37962.31
August 18 00:44:01 2011 EDT Close Trade AUD/USD 1.04831 50,000 0.0307 -56.5 -56.4693 37905.84
August 18 00:47:14 2011 EDT Sell Market AUD/USD 1.0484 80,000 0 37905.84
August 18 00:56:07 2011 EDT Close Trade AUD/USD 1.04776 80,000 -0.068 51.2 51.132 37956.97
August 18 00:58:12 2011 EDT Sell Market AUD/USD 1.04838 50,000 0 37956.97
August 18 00:59:18 2011 EDT Close Trade AUD/USD 1.04822 50,000 -0.0053 8 7.9947 37964.97
August 18 01:06:30 2011 EDT Buy Market GBP/USD 1.6515 55,000 0 37964.97
August 18 01:24:11 2011 EDT Close Trade GBP/USD 1.65112 55,000 -0.0107 -20.9 -20.9107 37944.06
August 18 01:31:30 2011 EDT Buy Market AUD/USD 1.04978 80,000 0 37944.06
August 18 01:37:22 2011 EDT Close Trade AUD/USD 1.05087 80,000 0.0357 87.2 87.2357 38031.29
August 18 07:50:10 2011 EDT Sell Market AUD/USD 1.04417 100,000 0 38031.29
August 18 07:55:14 2011 EDT Buy Market AUD/USD 1.04465 25,000 -0.0121 -12 -12.0121 38019.28
August 18 07:58:04 2011 EDT Close Trade AUD/USD 1.04497 75,000 -0.0565 -60 -60.0565 37959.22
August 18 07:58:43 2011 EDT Buy Market AUD/JPY 80.025 150,000 0 37959.22
August 18 08:18:29 2011 EDT Sell Market AUD/JPY 80.064 50,000 0.0766 25.4503 25.5269 37984.75
August 18 08:20:15 2011 EDT Close Trade AUD/JPY 80.097 100,000 0.1671 93.9604 94.1275 38078.88
August 18 09:22:50 2011 EDT Buy Market EUR/USD 1.43474 50,000 0 38078.88
August 18 09:27:44 2011 EDT Close Trade EUR/USD 1.43504 50,000 0.003 15 15.003 38093.88
August 18 10:03:45 2011 EDT Buy Market USD/JPY 76.502 50,000 0 38093.88
August 18 10:09:40 2011 EDT Buy Market AUD/JPY 79.29 50,000 0 38093.88
August 18 10:10:19 2011 EDT Close Trade AUD/JPY 79.323 50,000 0.0025 21.5667 21.5692 38115.45
August 18 10:24:06 2011 EDT Buy Market EUR/USD 1.42804 50,000 0 38115.45
August 18 10:24:40 2011 EDT Close Trade EUR/USD 1.4286 50,000 0.0003 28 28.0003 38143.45
August 18 10:27:46 2011 EDT Close Trade USD/JPY 76.553 50,000 -0.0091 33.3046 33.2955 38176.75
August 18 10:34:46 2011 EDT Buy Market EUR/GBP 0.86866 80,000 0 38176.75
August 18 10:35:32 2011 EDT Change Trade EUR/GBP 0.86866 80,000 0 0 0 38176.75
August 18 10:35:57 2011 EDT Sell Order EUR/GBP 0.86377 40,000 * 38176.75
August 18 10:36:16 2011 EDT Sell Market EUR/GBP 0.8684 40,000 0.0005 -17.1149 -17.1144 38159.63
August 18 10:52:05 2011 EDT Close Trade EUR/GBP 0.86911 40,000 0.0057 29.642 29.6477 38189.28
August 18 12:31:10 2011 EDT Buy Market USD/JPY 76.481 100,000 0 38189.28
August 18 13:38:16 2011 EDT Sell Market EUR/CHF 1.13134 50,000 0 38189.28
August 18 13:44:43 2011 EDT Change Trade EUR/CHF 1.13134 50,000 0 0 0 38189.28
August 18 14:52:55 2011 EDT Sell Market EUR/CHF 1.13531 60,000 0 38189.28
August 18 15:12:06 2011 EDT Buy Order EUR/CHF 1.15577 50,000 * 38189.28
August 18 15:12:29 2011 EDT Buy Order EUR/CHF 1.14858 60,000 * 38189.28
August 18 15:12:39 2011 EDT Order Cancelled EUR/GBP 0.86377 40,000 0 0 38189.28
August 18 15:12:44 2011 EDT Order Cancelled USD/CAD 0.97409 50,000 0 0 38189.28
August 18 15:39:37 2011 EDT Close Trade USD/JPY 76.538 100,000 -0.1433 74.4631 74.3198 38263.6
August 18 16:00:00 2011 EDT Interest USD 0.1561 0.1561 38263.75
August 18 16:00:00 2011 EDT Interest EUR/CHF -0.482 -0.482 38263.27
August 18 16:00:00 2011 EDT Interest USD/INR 12.9041 12.9041 38276.18
August 18 16:57:18 2011 EDT Close Trade EUR/CHF 1.13857 60,000 -0.1491 -246.4687 -246.6178 38029.56
August 18 16:57:21 2011 EDT Close Trade EUR/CHF 1.13859 50,000 -0.1243 -456.7505 -456.8748 37572.68
August 18 16:57:40 2011 EDT Order Cancelled EUR/CHF 1.14858 60,000 0 0 37572.68
August 18 16:57:44 2011 EDT Order Cancelled EUR/CHF 1.15577 50,000 0 0 37572.68
August 18 17:20:22 2011 EDT Sell Order NZD/USD 0.82713 10,000 * 37572.68
August 18 17:21:26 2011 EDT Change Order NZD/USD 0.82713 10,000 * 37572.68
August 18 17:29:05 2011 EDT Order Cancelled NZD/USD 0.82713 10,000 0 0 37572.68
August 18 18:25:30 2011 EDT Buy Market AUD/USD 1.03653 80,000 0 37572.68
August 18 18:37:15 2011 EDT Buy Order AUD/USD 1.03868 50,000 * 37572.68
August 18 19:07:00 2011 EDT Close Trade AUD/USD 1.03659 80,000 0.2488 4.8 5.0488 37577.73
August 18 19:07:09 2011 EDT Order Cancelled AUD/USD 1.03868 50,000 0 0 37577.73
August 18 19:08:58 2011 EDT Sell Market EUR/USD 1.43125 200,000 0 37577.73
August 18 19:19:29 2011 EDT Buy Market EUR/USD 1.43079 50,000 -0.0208 23 22.9792 37600.71
August 18 19:22:10 2011 EDT Close Trade EUR/USD 1.43058 150,000 -0.0781 100.5 100.4219 37701.13
August 18 20:06:39 2011 EDT Buy Market USD/JPY 76.687 450,000 0 37701.13
August 18 20:11:55 2011 EDT Close Trade USD/JPY 76.8 450,000 -0.018 662.0059 661.9879 38363.12
August 18 21:37:33 2011 EDT Buy Market USD/JPY 76.609 100,000 0 38363.12
August 18 22:31:53 2011 EDT Buy Market AUD/JPY 79.194 50,000 0 38363.12
August 18 22:42:53 2011 EDT Close Trade AUD/JPY 79.334 50,000 0.0423 91.4447 91.487 38454.61
August 18 23:22:03 2011 EDT Sell Market EUR/USD 1.43276 50,000 0 38454.61
August 18 23:22:39 2011 EDT Buy Order EUR/USD 1.43489 50,000 * 38454.61
August 18 23:33:00 2011 EDT Close Trade EUR/USD 1.43227 50,000 -0.0216 24.5 24.4784 38479.09
August 19 00:03:12 2011 EDT Buy Market USD/JPY 76.478 150,000 0 38479.09
August 19 00:24:47 2011 EDT Close Trade USD/JPY 76.511 150,000 -0.0246 64.6864 64.6618 38543.75
August 19 00:49:28 2011 EDT Buy Market USD/JPY 76.475 150,000 0 38543.75
August 19 01:10:20 2011 EDT Close Trade USD/JPY 76.535 150,000 -0.0238 117.5748 117.551 38661.3
August 19 01:11:57 2011 EDT Close Trade USD/JPY 76.534 100,000 -0.1634 -97.9957 -98.1591 38563.14
August 19 01:13:13 2011 EDT Order Cancelled EUR/USD 1.43489 50,000 0 0 38563.14
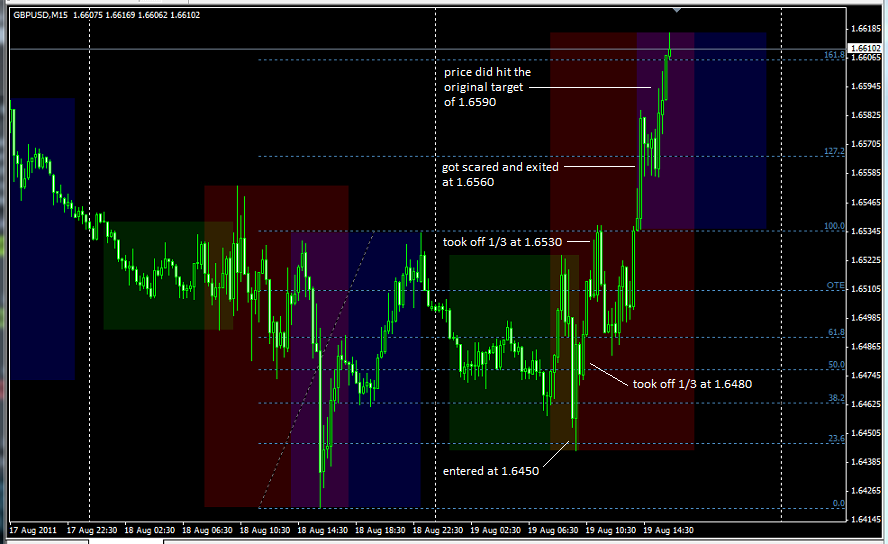
Cable seemed to have alot of up market flow, so I decided I wanted to be long today. There was a good OTE on the 1 hour which gave me a stop of 40 pips (ugh), but I couldn’t find a better entry on the smaller time frames, so I took it.
Thanks again, ICT. This thread is like having Cal Ripken for your little league coach. 
I like to add trendlines to my trades in the last weeks

Uploaded with ImageShack.us
This was the shortterm bullish trend that I said EU had broken. EU stopped to put in higher highs and bounced of LWH. Now GU trades lower and if it makes a lower low I’d say that it has fulfilled it’s seasonal tendency and put it’s high in for August and we’re going to trade lower into September(weakest month). I didn’t trade this setup as I couldn’t get a smaller SL in the right timezone, it’s just for analyzing purposes. Currently I’m waiting for the retrace to get a LC short off, maybe with higher targets today as we had some bigger moves down.
And the setups in LO today were amazing! Nearly perfect
greetings
EDIT: Well, sometimes it just don’t likes you

Uploaded with ImageShack.us
You can send a PM to manta and he will mail it to you,
I already wrote some days ago, that you can again download MF indi from my site (with some other stuff as well, time to time I post some of my tools there):
Awesome week there coolkaps! I noticed you trade some AUD pairs? Are you using the ICT method on these pairs as well? IE pivots, fibs, top down, SMT (if so what pairs do u SMT with?). I am curious :). Thanks, and congrats on your amazing profit this week.
Figured we were in such a sell zone on the cable that’s all I shot for. Had one get stopped out RIGHT at my SL, not cool. Made it back on the next OTE short. From there, noticed a sharp trendline up on the stochastic’s lows, and closed up shop right before it shot back up the way it did.
With price above the center pivot, well over the higest line in this week’s trinity, and a bearish directional bias on the daily, why did so many of you go long so confidently? Now I wish I would have! 
Of course it has traded very high but we’ve seen some correction and continous upward moves coming from the bottom of Traders Trinity, with a bullish flow and the high you can spot on daily just about 150 pips away, which equals one trading day. So it traded up before falling down a bit in LC. So this move down what we’re seeing in LC could also be a correction to prepare for the run to target this high and shoot the SL resting above there. Currently it bounced of LWH and tends to stay above it, signaling another bullish bias. The only thing which confuses me this week is SMT. EU keeps failing to trade higher. I think I wil watch a bit from the sideline and see what’s going to happen
greetings
Don’t feel bad, you were not the only one in that boat. I was not even considering buy signals, now after reading FXNumberuno’s post it is very clear why we should have been. I got 30 pips on the LO down movement but missed that glorious up movement as well
Hi, ViciousP. I was bullish on cable because there appeared to be upward market flow on the daily, 4 hr, and 1 hr (just barely on the 1 hr). And also because it looked like a pull-back on the 1 hr. I haven’t learned about the trinity yet, and I didn’t put on the pivots because I thought I had confluence across the time frames. I’m not really sure if I did it right, though, it could have just been luck with the timing, especially since cable fell so hard during NY.
Yep I was the same, Daily SMT, over bought Weekly & Monthly TT and it had spiked through the old daily highs already.
It’s been very hard to get a solid handle on things.
But thats 3 days now of cable trading down to the MR1 and turning during LO only to trade back down to where it started more or less, I find that a bit suspicious. It will be interesting to this weeks COT data.
If you had traded just the basic pivot trades this week, buying in the buy zone selling in the sell zone, except Monday, you would have made out like a bandit. It just goes to show you, keep it simple stupid with money managment works well.
Wally
P.S. Not that Im calling you guys that got it “stupid”.
P.P.S. Or “simple”.
P.P.P.S. Just “smart alecks”
Thanks Zneve,
I use my own way which works for me, I use ICT money management trick.
Allso, like his webinars so I take some small positons for small swings But I close all the positons at the end of day except my long term carry trade.
I draw FIBS and also I do some speculations.
-
Like IF USD JPY is down on friday till 11:30 a.m , It will go up for sure as no one wants to keep position over the weekend with down USDJPY as chances of japanese intervention is quite high so today also I traded at 76.13 to 76.50 with 30 per pip as I was confident in my analysis and if it went down 50 pips , I would have purchased more.
-
SP500 futures down then AUD and FIBER down(very straight fwd) . Now SP500 is down too much it may look SP500 try to move up then AUD will be down in asian session and it will go up later. . if I get the confirmation direction Up, i will look to buy.
Normally tuesday, wednesday If AUD direction is down, moves are very big. -
when pair reaches high and reverses back , if it reaches within 6 pips of taking that high… It normally goes 10 pips higher then the last high so eat all stops so I try to get easy 10-15 pips there and some time it eats larger stops and move is 20-25 pips
my stop loss at this point is 15 pips.
Nice article about indicator from course instructor for Newbie’s
A major concern of newer traders is which is the best indicator for them to use in their trading. Also, they want to know if indicators broken down into beginning, intermediate and advanced trading categories?
Personally, I don’t think of indicators as being beginning, intermediate and advanced or this one is the best and this one is the worst.Rather, I would suggest that you familiarize yourself with all the major indicators and then settle on the one or two that you find make the most sense to you. Someone else’s “ideal” indicator may not appeal to you at all and that is fine. Use the one(s) that you understand, feel comfortable using and assist you in putting pips into your account on a regular basis. After all, pip accumulation is the final arbiter when it comes to evaluating the success of one’s trading.When going through your indicator evaluation process, I recommend that you only put one indicator at a time on your chart. This will make the chart less cluttered and bring more clarity as you compare one indicator to another. Moreover, it will be easier for you to evaluate the indicators individually as opposed to attempting to evaluate them en masse.When you finally decide on one or two and begin using them as a part of your trade analysis, remember to consult the chart first and the indicator second.
By that I mean we want to focus on taking trades in the direction of the Daily trend. The trend is the deciding factor in whether or not we will be buying or selling the pair. Then, after that decision has been made, we check the indicator. We are looking to see when the indicator will provide us with an entry signal to trade the pair in the direction of the Daily trend. Don’t simply focus on the indicator to determine whether you buy or sell the pair. If you do that you will find that you will be entering trades that have a lower probability of success…those that are against trend.The indicator cannot provide you with the trend but the chart can. And the chart is where your analysis should begin.For the record, my personal indicators of choice are the MACD and Slow Stochastics.
Thanks Ali!
thats really helped me see the picture clearly on COT and I can now understand the mechanics of how and WHY it works like it does!!
Top man!
GLGT
I was thinking about Traders Trinity concept and was curious what happens, if I look at those zones as Support & Resistance levels. And I went a bit further beyond inside-candles…what if I take an average range from the last 3 weeks or months, cut it to trinity zones and add this measurement to the previous period (week or month) extreme, so I can get SR levels beyond trinity zones. The result is funny, I think you will like it…
Download here: MantaFX.com - FOREX Pub

Interesting manta, but I’d like to know exactly what you did. DID you use the last 3 weeksh high low? or sommething else?
I tried two methods (results are more or less the same):
-
take the last 3 candles (weekly or monthly). Find the candle which range (High-Low) is medium (not the largest, not the smallest candle from these 3 bars). Then split this range into two parts: 1/4 and 3/4. Add 1/4 to previous week high and you get Resistance 3, add 3/4 to previous week (or month) high and you get Resistance 4. Do the same for supports.
-
that’s almost the same, just calculate average range from previous 3 weekly or monthly candles (W1+W2+W3)/3.
I was thinking to split the ratios like this: Extreme + 1/4, Extreme + 1/2, Extreme + 3/4, but that would be 2 more lines and that is too many I guess.
Hope it helps.
Actually when I look at this stuff now, 1/2*Average Range is not bad level at all. I will add this level as well.
[QUOTE=Manta;275480]I was thinking about Traders Trinity concept and was curious what happens, if I look at those zones as Support & Resistance levels. And I went a bit further beyond inside-candles…what if I take an average range from the last 3 weeks or months, cut it to trinity zones and add this measurement to the previous period (week or month) extreme, so I can get SR levels beyond trinity zones. The result is funny, I think you will like it…
Interesting stuff Manta.I like the way your outer resistance got the weeks high.
I don’t think you need to get as complicated as that though.Been wondering how the Trinity would cope in a trend and have tried adding fib extensions to the resistance and support zones.Some of the results are amazing.
If you pull your fib from the inner res/support level out so that the 50% is on the outer level,then look at where the 100,127,162 and 262% levels are.
For instance this weeks high is at 127% ext; better one is the low of week 1st-5th Aug. The best I’ve found so far is the period from 23May to 8 June, a strong trend up from 14000 to 14650.Draw the extensions in for Monday 23May and Monday 30 May and be amazed.Look how the fibs drawn on 23 May predict the following weeks high on Friday 3 June; and those drawn on 30 June predicted the high on 8 June. Not to mention all the extension levels on the way.
Ain’t that beautiful?
OK. How about this version (v. 1.1): MantaFX.com - FOREX Pub
Support and Resistance lines are fibo extensions 1.27, 1.618 and 2.0. Huh :22:
EDIT: like a road map, isn’t it? :27: