I went the other way lol. With the large gap on fiber and the Japanese bank holiday I waited for LO. With the buy zone pivots, skimming the buy zone TT and a big gap I thought (1st mistake!) the London boys would see value and went long near the end of LO (at about an OTE short, clever me). I’ve been bullish for a few working days with COT data and nesting OTEs on the higher TFs but in spite of no identified entry point I bought. 1% no major drama but stayed flat after that as my analysis was so out.
The uncertainty over Greece was looming again this morning which didn’t help my cause and to try a gap trade without Asia was foolhardy.
As mentioned by Ali, some dialogue on Macro ecconomics might be nice, if within the remit of the thread.
Edit: Oh yeah and I was counter trend again. I’m studying Sam Seidens Supply and Demand videos and I like his “market narative” but in my own identifying of levels, to add confluence to an ICT trade, I’m struggling. With practice I think they will be a useful addition to the tool box so I’ll stick with it for now.
So I live in mountain time, which I thought was GMT-7, so why does my chart (MT4) - which I was told the time is just set at GMT - show 08:00 when it is midnight Mountain time? It seems like it should be 07:00 GMT at midnight here, no?
Coming off of the weekend, my daily pivots are off. I have them set to GMT - 5 to show midnight to midnight EST and it was working fine last week, but come this morning, the pivots started at 0:00 GMT. Is that simply an oddity of the new week? If so, does it screw up the pivot values? Should I just draw my own vertical lines at midnight EST and calculate my daily fibs pivots manually?
3)Finally, when ever I try to scroll back any significant amount of time on MT4, like when looking for S/R levels from weeks or months ago, the chart always moves up and down with the price action. Is that just something that is gonna happen no matter what, or is there an option to take it off? Only way I seem to get around it is to zoom WAY out, but that makes things difficult. I’d like to be able to drop a horizontal line at an area of potential S/R and then trace it back in the charts, but it always disappears…does that make any sense?
Thanks for bearing with me as I get the hang of all this.
Your broker may be wrong with the time, double check with them and make sure that the candle time isn’t different than what you see below it. Sometimes the candle may be 12:00 but below on the chart only 11:00 shows up, can throw you off.
Weekend pivots show depending on how your broker pushes information and how they handle sunday’s data. Sunday prior to London can be a little wacky with the programming, if you are having big issues that seem out of sync then calculate them by hand using the excel sheet on the first post.
This is normal behavior. Zoom out or use a higher TF and then mark the area you are interested in and zoom back into it. I use mt4 for charting and I actually have a different java platform for entries which is why over time my charts are different, it depends on which program I grab them from. The Java platform I can lock between price range which you can’t do with mt4; pros and cons but mt4 is extremely new user friendly .
Thanks for the help Hordane. My candle times are definitely the same as the times on the bottom of the chart. Are you thinking that the broker might not be using GMT? You can see in the pic below that my daily pivot levels seem to include 7:00 EST-Midnight…
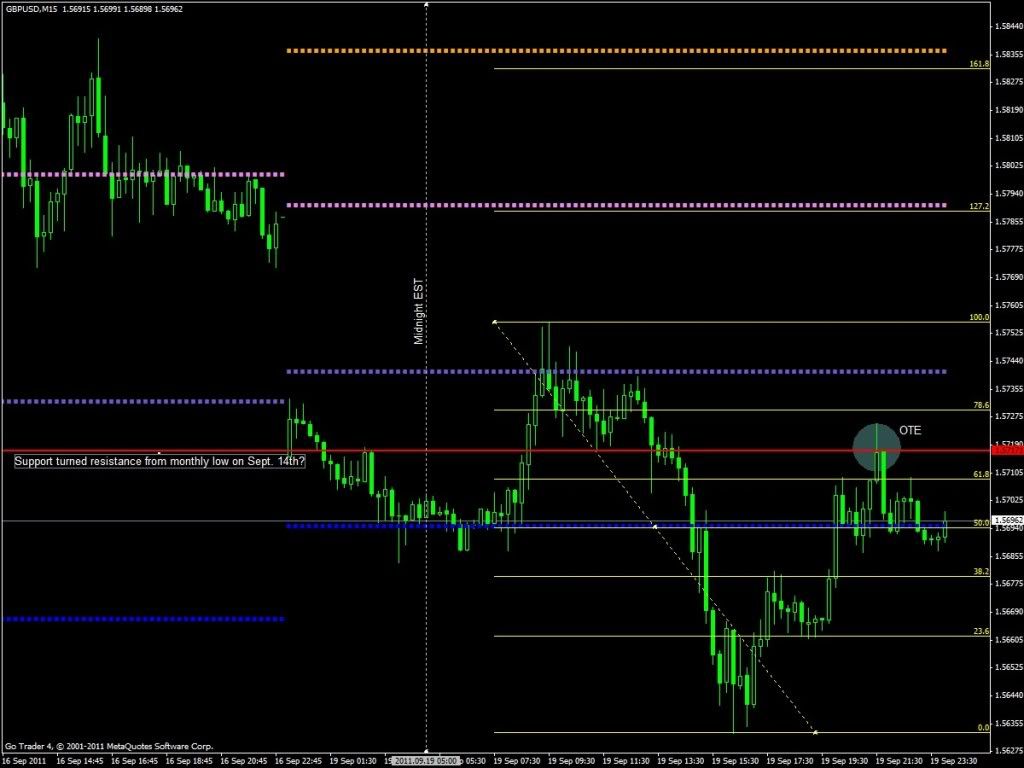
Anyways, would like your thoughts on a demo trade I just took on the GU
Support turned resistance from monthly low on the 14th
MS2 level
Confluence of OTE and 2 & 3 using Fib from daily high to low
Entered at 1.5717, SL at 1.5741 (S1). Didn’t really know where an appropriate take profit level would be. Would really like to hear your thoughts on that, and the rest of the trade. Thanks!
If you traded short ChaChing. S&P just lowered Italy unsolicited and it shock the heck out of the market (80 pips short on EU short in 4 mins !) . The trade factors you listed are sound, some would not take the trade since it isn’t in the time strike zone but we are in Asia open more or less. ICT has suggested taking some profit at 30 pips and definitely some profit at 100% to scale out and leave some on for the extensions to see if it gets that far.
Yeah, sorry I should’ve said I took the short. FAKE MONEY CHA-CHING!
Would you mind being more specific about the 100% and extensions you are referring to? Is that on the daily high to low fib, if so that seems far…? Thanks
When you draw the fib you have a 0% and a 100% (top and bottom). Once you have your OTE entry you want to draw your fib extensions to try and see where PA ‘could’ go in the longer run. The 100% in this case id the 0% fib as shown on your chart. You are short so if you drew your extensions you would draw your fib top/down. You definitely want to take some or all profit if the PA has moved from the OTE entry that far.
Okay, thanks. I had looked at that and it just seemed too far away to assume that price would go there. Currently price looks like its kind of consolidating between that 30 pip 1st TP and the 100% TP. I guess if I was risking real money, i’d be worried that price was going to turn back up and I’d lose a lot of the gains from the swing. After taking that 30% off at 30 pips do we just sit and wait for it to go to 100%? If it doesn’t get there, then what? At this point I would have moved my stop loss to break even at least (and I’ve already banked that 30%), but I’m uncertain as to what the best way to manage the remaining 70% is, especially if you see price start to turn against you. Does it go to the 100% level enough that I should just trust it?
You can join the session and gain a seat as early as 8:45pm, prior to that you will get a message stating you are trying to join a Webinar that has not begun… try again at 8:45pm or later. I will not be joining the Babypips chatroom as it apparently limits member access.
Can I confirm the homework assignment? Find the 30yr Bond seasonal tendencies using pricecharts.com which is free for a month. Well I checked pricecharts and it seems that it is $9.95 for a 30 day trial. That is not a problem, but I need to confirm it is the right place to look because I thought the seasonal tendencies came from Moore research. The COT data weekly chart can be found here for free, can it not? http://snalaska.net/cot/current/charts/US.png Is this what we are inverting and placing over the Fiber chart?
It seemed quite clear in the webinar, but I am all confused now!
Regards
(THIS IS NOT ADVERTISING…DON’T GIVE YOUR MONEY TO THESE PEOPLE!!)
It looks as though Fiber is printing a Higher Low whereas Cable is printing Lower Low on the SMT daily divergence. Am I reading this correctly? If so, would SMT be telling me to look for long position on Cable? I haven’t totally grasped the SMT concept so any input would be appreciated. Posting the tool and what I see below for a visual, thanks.
it’s really a good collection of video tutorials on forex, later today i’ll sure watch them one after one and i will note down in my diary about what ever i learnt from your videos.
Once again Thank you So much for sharing this for us.
:35:
BabyPips + Forex = Extra $$
Yes that’s the idea behind it, more easily seen on a 4 hour chart.
It doesn’t necessarily mean you have to buy Cable, you will see you have OTE on the FIBER pulling a FIB from the low of 3495 to the high of 3935, but your possible PIP potential is greater on Cable.
You can use this tool as a relative strength tool as described above or a confirmation tool that your decision to trade long is correct
Slowman,
I see what you’re seeing - I think - but wasn’t that a bit early for London Close trade? LC, as I understand it, is typically looked for/develops around 11:00-13:00 Eastern Time (which is 15:00-17:00 GMT). According to my chart, your entry was almost an hour earlier. Am I missing something?
countertrend time today OTE in OTE in OTE in OTE on Fiber today hehe. Opened in LO at 1.3604 in the OTE after the second bounce of S1, showing that it is unable to trade through, indicating strength. Targeted 211.8 fib projection, in line with R1 and equilibrium, closed at 1.3706 for 100 pips. Could also close with my normal rule for closing when LC Killzone begins, would have been 5 pips or something more, but as it was a countertrend trade I didn’t expect a trending day that finishes it’s move in LC. 261.8 projection was hit perfectly too, but I wasn’t at home and I wanted a “sure” target hehe. Missed about 40 pips with this, but it was only a spike and I don’t want to get to greedy when setting target 4h before London opens hehe.
Now it’s showing kind of weakness, failing to trade through equilibrium multiple times. I’m not quite sure if we’re going to see further upmoves so I’ll stay out and wait for a clear signal in either direction. Today could have been a good day to launch the uptrend in the OTE, but the range wasn’t quite much and it’s down a bit again now. Commercial were still increasing longs on Friday, expecting price to go lower. Let’s see
Thanks Ali for your offer, but I’d like to have the data in the spreadsheet because it makes it very easy for me to compare everything and I wanted to copy and paste it in mine because I’ve put in some other calculations
Does anyone have an indicator that automatically puts a vertical line on a chosen time? I don’t like the coloured boxes
I had set up a trade on the cable but it took off south before I got filled. The fiber technicals were lining up nicely so I went for that.
Confluence of S2, the 60 institutional level, bearish market flow on daily, four hour and one hour. Hit first TP at 30 pips. Price stalled briefly and I wasn’t sure if we were gonna have a z day so I took second profit at 25 pips instead of 100% fib.
Moved the remaining SL to lock in a bit more profit but still giving it 25 pips to move. Let the remaining portion ride to TP at 127% fib, just before S3. Trade went well. I don’t mind having taken out the middle position early, it gave me more confidence to let the final position run as id already banked 66% of the trade.
I did try to trade what the markets presented and not forcast what I hoped would happen. Thinking in terms of probabilities.


