[QUOTE=sladhaFX;280679]Slowman,
I see what you’re seeing - I think - but wasn’t that a bit early for London Close trade? LC, as I understand it, is typically looked for/develops around 11:00-13:00 Eastern Time (which is 15:00-17:00 GMT). According to my chart, your entry was almost an hour earlier. Am I missing something?
I have been using 15;00-1700 London time which is gmt +1 and its been working well for me so far! not sure which is right.
London Close Killzone is 1700-1900 London Time, 1600-1800 GMT. I look for price to exceed it’s ADR too for a valid signal. A bounce of a important Support/Resistance improves the strength of the signal.
made it the wrong way, I’m in GMT+2 so it’s 1700-1900 for me Excuse me, my broker is GMT+3 so I get messed up a bit sometimes hehe. 1600-1800 Londontime is correct
Here’s yesterdays recording of the aborted Asia session webinar. I edited it out the boring bits where ICT if off talking to himself and we’re all sitting around wondering where he went. I’ve placed some noted and comments on the screen but treat this like an audio book and listen to what he’s telling us rather than what I’m trying to show on the screen.
Micheal is now going to make up a Asia session presentation and post it later. DodgyWebinarICT
The inbuilt player keeps stopping for some strange reason but you can just play the .MP4 file in your favorite movie player or just keep hitting play button.
Wally
p.s. Apparently I missed the end bit and ICT did come back. Sorry about that.
Thanks, Wally. Good to review the Webinar. It wasn’t on the end of your video, but did you happen to catch the stuff on bonds and the COT data? I think SladhaFX also said he had got it noted…any leads, guys?
First of all I want to thank you for posting such wealth of information. I am reviewing each of your videos and they are really helpful. I am quite new in forex trading and I want to learn how to develop a trading strategy. I recently joined ExeliaFx.com and I am trying my luck as a new free user. But I have so many questions and it’s like I have a lot to learn before I can trade with real money. Do you have any tips for a starter like me?
Thanks again for all your valuable inputs. I look forward to learning from you.
“Sign up on pricechart.com for 2 week trial- pull up COT weekly bond chart, screen capture and cut/paste COT and plot it inverted on EUR and GBP weekly chart”
I don’t think ICT mentioned what we should see; rather, he left it open ended so we can check it out for ourselves.
I’ve never been completely clear about what it is we need to be looking for with the treasury bond data. Instead of asking us to spot the difference, could you actually point it out for us? And then perhaps add what it actually signifies? It would be deeply appreciated.
If you were an investor looking to invest your money overseas, where would you put it? In the country that provides the better return (ignore risk for now I’m speaking in relative terms).
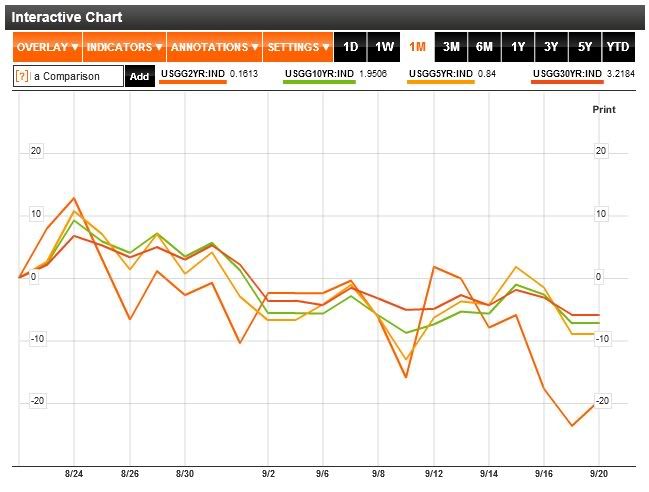
So in the chart above it looks like the 2yr and the 30yr US treasury yields are putting in lower lows and the 5yr and 10yr US treasury yields are putting in higher lows. This means yields are poised to move higher which means foreign investors will be more attracted to investing in the US, therefore increased demand for dollars= stronger dollar. I’m still trying to figure out when we can say “ok a lower low has just been put in and a higher low has just been put in so we have divergence and US yields are poised to move higher”. The 5yr and 10yr could still reverse and go lower, so maybe you can say if we have higher closes for 3 days we can confirm the divergence? Not 100%, guess it all comes with experience.
Many thanks for attempting to help out here. I genuinely find this material puzzling and my questions are all intended to generate enlightenment. Let me comment piecemeal:
Well, OK, but I think risk and bond yields are very closely related.
You’ve shown the 2-year bond, so I think that ‘20yr’ is a typo. However, if you did think that the longer-term bonds were moving lower, versus the shorter-term ones, this would have been a mistake - because it is the very short- and very long-term bonds to which this applies. I am not sure I can even see the ‘lower lows’ and ‘higher lows’ here, though. To be honest, they seem to be all jumping around for me. Lastly, on this point, these charts do not show the actual yields, but only relative changes in yields. How that change is calculated (ie, as a percentage of what?) I do not know. I’ve taken it on faith that what ICT said about yields applies to these derived values, but he never actually clarified this.
Well, my understanding of bond yields is that a government does not offer high rates unless it needs to (see Greece, for a topical example), therefore a low yield rate is an indication of high [I]demand [/I]for a bond. This may indicate inward forex flow seeking a safe, but low-return, haven. Given that investors do seem to be moving money into the USD, wouldn’t we expect to see these yields continue their downward trend?
I sympathise I am very uncertain about using yields as a tool, mainly because I just do not know what was really intended when this was first explained, and even when I looked at the correlation of failure swings in this data, it was pretty tenuous, to say the least, and not something I would expect to be of use to the general newbie reader of this thread.
I’m going to assume ICT was talking about the PRICE of bonds and not the Yields but going by that logic aren’t the yields the inverse of the price? and therefore we can chuck up a 30y yields with the EUR for free and without inverting anything?
Ouch! my head hurts…
EDIT: OK, so I got onto the charting site that ICT recommended and got access to the charts he is looking at. My first stop was the Monthly Futures chart for 30 yr T bonds, and then the Monthly Futures chart for the USDX and the Fiber. First I drew trendlines on the T-Bonds chart and USDX chart as I could see that since 2000 T-Bonds have been in an up channel (bond prices up, yields down) and the USDX has been in a down channel. So we can assume that higher bonds = lower USD, and thus higher bonds = higher Euro.
I then looked at the COT data on the Weekly chart for T-Bonds, and saw that the Commercial traders were at an extreme long position in March/April 2010. We know that this equates to a low in the T-Bond market, but we don’t know the relationship between Bonds and the USDX. Which begets the other? So the Commercials put in their extreme position, the Bond market bottoms out, and then about 4 weeks later the Euro Commercials put in their long extreme position, and the Euro bottoms out!
So moving onto September 2010, the Commercial T-Bond traders put in an extreme short position, the bond market tops out, and then in October 2010 the Euro follows on the same path. This happened again in April of this year. The bond market bottomed out the second week in April with the Commercials at a 1 year extreme, and on April 28th the Euro headed lower.
I can see how the 30 Year T-Bonds diverged with 10yr bonds, 5yr bonds and 2yr bonds in Sept through Oct 2010, but for me it is the Commercial COT data that is the real trigger. I struggle with seeing other divergences at important tops and bottoms, but maybe that is due to the perf chart we are using. It is also worth noting that these occurrences happened on multi-year trendlines.
Is that the crux of what you are saying: that bond futures predict Euro futures? And hence low bond prices precede low EUR/USD prices by about a month?
'old on a minute…that last one didn’t figure did it? T-Bonds bottomed and Euro topped this April! Ah, I give up with all these squiggly lines. I don’t mind admitting defeat Anyone else care to give it a stab?
Anyone take any trades on LO or NYO today? In hindsight I can see a EUR short trade at LO & EU Long at NYO but this morning I was not able to make sense of what was going on. I went into the day with a Long bias, maybe that is where I went wrong.
EUR Market Flow was up
GBP Market Flow was down
These were not the only things that gave me my initial long bias but as I am typing on a cell phone it would difficult to explain my whole analysis
I was aware of the high impact news release on GBP this morning & the USD later this afternoon.
I remained sidelined as I was unable to make sense of what the market was doing at the time.
Can anyone who traded or analyzed the market at LO or NYO provide some insight as to what they see or based their trades off of. I appreciate the help.
Quick newbie question for all you experienced people out there. I was under the impression that we are to be drawing our daily pivots using midnight-midnight EST (GMT -5). However, as I review the ICT videos, I see he uses mainly GMT0 in his pivots, and OCCASIONALLY goes to GMT -5. Also, I just downloaded the ADR indicator from ICT and it looks like it lines up with the daily pivots calculated from GMT 0. So…which one is? GMT0 or GMT -5? Thanks.
Matty
Edit: Just watched ICT video from 02-08-11 and it talks about the GMT0 and GMT-5. I believe it stated that using the daily pivots with GMT -5 is good to set up the London open trades. I wasn’t clear if that was the only time to use -5, and then we should use GMT0 for everything else…sigh This is really frustrating me…:34:
 Excuse me, my broker is GMT+3 so I get messed up a bit sometimes hehe. 1600-1800 Londontime is correct