There is an Asian Session video, that explains how ICT trades that session. He talks about this session as usually unwilling to make a new high or low - and gives tips on what he would do.
I think that may help answer your question.
PerchTird,
I really appreciate you commenting on my post.
I went through the Asian Session Video awhile back and actually wrote down word for word everything ICT said. He does talk about the pattern can form a Turtle Soup because it can be unwilling to make a new high or low. In this case it was unwilling to make a lower low which was 1.5820 area. In the video I mentioned it sounds like he didn’t enter until 1.5835 which means price started traveling back up 15 pips before he entered long. To me that seems like it’s just in the middle of now where. It seems like it would of been better to put an order in to take a long as price slammed back down in the support.
I just think I am missing something here.
Thanks,
Ok, taking a closer look at the video I was talking about (PTC 01/31/11) it looks like the 1.5835 level he enters at is the break of the recent candle that went below friday’s lows.
Is the the way to enter a turtle soup pattern, is on the break of the recent candle in the opposite direction of which it raided the stops?
Thanks,
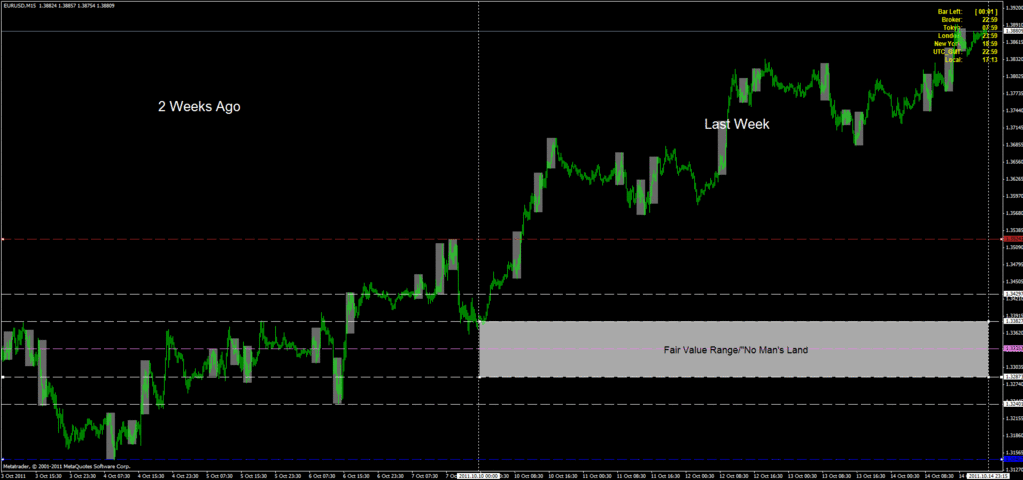
Okay, so I just finished watching the trader’s trinity video and thought it was great. I said to myself, “Hey, if I limit my trades to the areas outlined in the video, I can significantly increase my % of profitable trades.” THEN, I went and laid out my chart like the video for two weeks ago to see how it lined up with this last week, only to find that the entire week was above the “fair value range” that ICT talks about. Now I’m not surprised at this, becaue I know the market is going to make moves up (or down) during a week that won’t be so horizontal (for lack of a better word. My question is, what are we supposed to do with this tool when conditions look like this…
Do I only look for shorts all week since we are in the “Trader’s Trinity Sell Zone”? 1H and 4h MF were up for most of the week though, so that doesn’t sound right…Can anyone explain to me how I would have used the Trader’s Trinity concepts this previous week? Thanks so much!
Matty
Previous week’s High and Low are significant S/R markers, and you can trade them like classic S/R levels. In this case, Broken resistance (last week’s high) becomes support for this week.
The bears wanted to push price back into last week’s range, but the bulls wouldn’t even let the High get touched, which to me signalled further bullish range expansion.
Also if the bears had more power, I don’t think the initial break above last week’s high would have travelled so high up. The weekly high got taken out like a hot knife through butter. If I wanted to play the action back into the range, I would’ve rather seen some more congestion around last week’s high.
That’s good that you were watching the 4H flows, it’s a good perspective to have when looking at this template.
edit:
I feel the need to remind you that there is MONTHLY trader’s trinity as well. I find watching monthly trader’s trinity on a 4H chart makes an excellent template for finding some quality setups. I simplify the weekly trader’s trinity to just last week’s High, Low, and Midpoint. That’s my preference anyway!
Hi all,
Just missed an entry on the asian session!!!
Here is my analysis:
Fiber 15min chart.
1- Last Friday NY session was Bullish
2- Fib from High to the Low
3- Retrace at the 79%
Bleu box would have been my OTE
Short for a 20 pip profit objective.
I am sad I have missed the trade. I was just busy in by charts making my Top Down analysis.
Cheers,
Edit: As I was reviewing my post, I noticed in my chart that the Fiber opened with a GAP. Would this be a possible Whiplash Buy & catapult short formation? 
Your fib is upside down.
Remember if your looking for an UP leg then start your fibs from the bottom and draw UP so the 100% is on the Low.
A DOWN leg start the fib from the high and drag down to the low so the 100% is on the high.
Wally
Wally,
I was looking for a Down leg (Short)
Maybe what make 'its confusing is that I pulled the Fib from the high on the right hand side and dragged 'it down to the low on the left hand hand side of my chart.
I was really looking to have a short position since the NY session was bullish.
Cheers,
Bucknaked,
For a sell you want to pull your fib in the direction on the way you want to trade. So for a sell you want to pull it from high to low, left to right. You pulled the fib from right to left. Also you want to see price go down then back up 62% - 79& of the move you are looking for. In the picture you are showing the price only went down about 25% to your sell.
Don’t take this the wrong way but you have this concept completely wrong and I suggest to look over the videos again.
I am on my fourth time going through all of the video’s. Plus one word of advice, take notes, notes, and more notes.
Thanks,
Hey ICT,
I’m glad you have started your “Million Dollar Challenge”, so far it looks like you are doing well with it! I am still here, creeping this thread everyday and chance I get. I wish you the best of luck with it! Hopefully we see that million soon! Looking forward to seeing the entire journey.
Also, I’m looking through the Asian session video right now, hopefully I can trade this as it fits well in my schedule and classes. Regarding the gap trading during the Sunday open, what kind of SL’s are recommended in order to give it enough breathing room while keeping R:R ratio’s high? Do you use a fixed 20-30 pips?
Hey AK,
It’s nice to see you’re back trading again, how have you been and your trading for that matter? I’m in Edmonton now, let’s meet up sometime if you have the time!
Nice to see so many new members as well, going to try to keep myself caught up with the posts and try to start contributing again soon!
Regards,
Clark
PIPhanger,
Ok I got 'it… I can now visualize what I was doing wrong.
And by the way, don’t worry, I take all comment the wright way, I have a positive attitude !!:p:p
Imagine if I would have kept doing this mistake !
Cheers,
Hey peeps, I’ve been studying ICT’s vids and posts. I’m new but I get the bulk of what he is teaching.
Regarding the Asian Session. I see this as an excellent session to find position for the trend. The trend is up on the EU so I look to the Asian Session for a low for a buy. Per ICT, looking at the history, the Asian Session rarely goes outside of the New York hi/lows. Perfect! I find a low during this period which really works for my evening hours on the US west coast.
Shaved about a year off my learning curve on this alone!
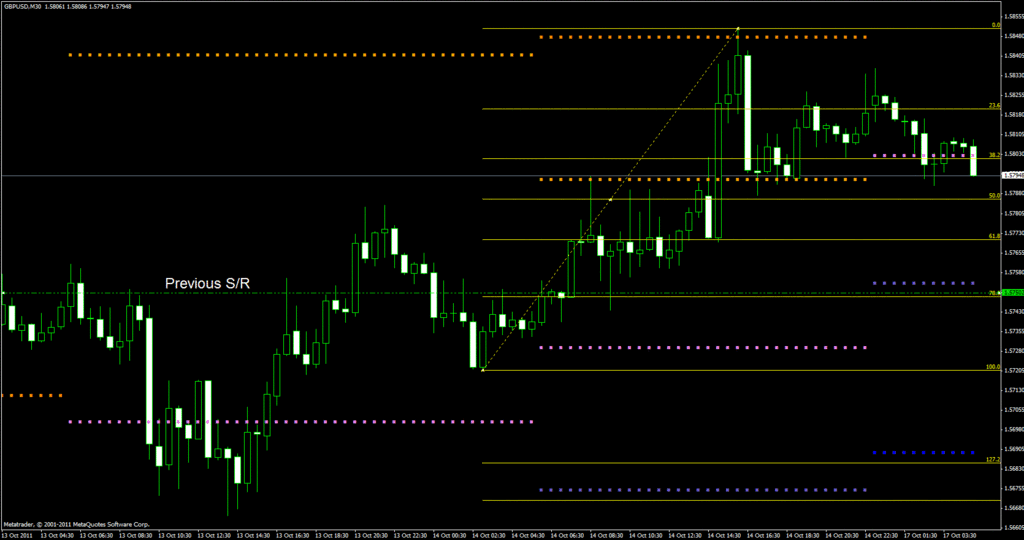
So I was just looking at my charts and was curious if anyone else was looking at the 1.5750 level on the cable for a potential LO long. My reasoning:
- 79% retracement from Fridays low to high at 1.5748
- Long term S/R level at 1.5749
- Institutional level
- Todays S1 (using NY pivots) at 1.5754
- 1h, 4h, and 1D MF bullish

So if price reaches OTE sweetspot during LO, I’m thinking of going long.
Curious to hear other people’s thoughts. Thanks.
Matty
DO IT.

The bias is long, you’re finding a prime low to begin in the Asian Session. IMO.
I just placed a pending order with my new partial close EA that I’m trying for the first time…
But I’m not totally sure what you mean by “you’re finding a prime low to begin in the Asian Session. IMO.”
Would you mind explaining that to me? Thanks.
Matty
Matty
Your logic seems good. Two questions, though:
- From what point does the long-term support you mention come from?
- What is the basis for your pivot? I have the GMT S1 at 1.5746, but the GMT-minus-five-hours (ie, NY time or EST) one is at 1.5758. Moreover, I have noticed that quite a few people say that pivots should be calculated from 21:00 GMT, which is the time at which the forex trading week opens and closes. This is effectively a GMT-minus-three-hours setting, and the S1 level on that basis is 1.5755. I wonder to which you subscribe.
Cheers, Pajo.
Matty,
Another question - more important than either of my earlier ones, really: what TP have you set?
Cheers, Pajo.
Hello!
May I ask you where I can find the indicator with sessions from the bottom of your pics?
Thank you very much,
Iuli
I took a trade today on LO,buy on cable.Reasons for trade:
-MF up
-previous day dR1
-buy zone
-put a fib between low and high of previous day NY session.
Edit:After the price has moved 50 pips in my favor,went down and stopped me out at 1.5755…-37 pips!
Were you at your computer throughout kill zone? If you had been watching 15M Fiber and Cable side by side between 9am and 10am local time, then the price action should have alerted you to the fact that it was failing at resistance. The divergence that set up shifted probability away from your long position, and it may have been an idea to shift that stop to around 1.5800.
Best regards


