I guess I understand what you’re saying about the street money thinking the down trend would continue, but I don’ t see how you can be so sure that it was DEFINITELY a buy day? Is that only based on Wednesday closing right at the low? Do you remember where/when ICT talks about that?
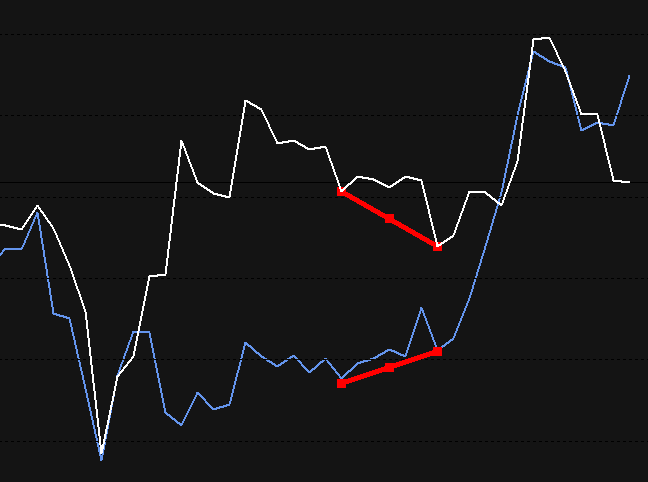
This is what I was seeing during LO…
Stops to be raided by a quick move up
And BEARISH divergence on SMT
*Blue is Cable, white is Fiber
Not trying to be argumentative here at all guys, and I appreciate your comments, just frustrating when others see something you clearly dont :56:
Matty
Watch the New York Open video, that one shows it nicely right at the start. 12:40 seconds into that video…
I was watching the euro. It seemed to make a nice judas–jumped down about 25 pips below asia then shot up. There was even a pretty good ote. But looking at the cable, It didnt get out of asia on the low side, but it tried. It went down on LO but didnt make it out. Then, it started heading up when euro did. euro went back to asia-cable didnt-its still above. So…I think maybe the judas was there on the euro and cable was kinda there in sprit but didnt have enough steam. Then it went up then just started fading out. No gas. It is, after all, the day before New Years Holiday Weekend. Im gonna chalk it up to that.
Looking at it again, it looks like there was bullish divergence at the exact same time…
sigh
How do you know which one is valid?
The bearish divergence was 100% correctly spotted, but it was only one portion of the move for the day. So you could’ve taken 30 pips or whatever on that short, but then you would’ve seen bullish divergence at about 9AM GMT, because EURUSD was making lower lows since the start of the day, but GBPUSD failed to do so - it couldn’t break below the Asian range like the fiber had.
I see what you’re saying, but what stops were being raided on the Euro? Doesn’t seem like an obvious place stops would have been taken out by the move down out of asia…
If price is trading upwards then compare highs to highs, if price is trading downwards then compare lows to lows.
Remember the SMT divergence is only a confirmation tool, don’t use it to predict price swings - that’s something I’ve learnt too many times  Rather arrive at your analysis by other means, such as the OTE that formed at that point, and then look for divergence as a confirmation signal.
Hope that helps 
Now go to this post, In this post I’ve used the basics to determine reaction points, places in the market where price turned. Those are big support and resistance levels I’m using, Most of the time they give you trades. Personally I almost always expect a bounce at these levels and honestly these levels are the only thing that kept my head above water otherwise I would have drowned long ago. Go to each place on that chart where I marked it with a X, go down to a 15 min time frame and study the days price action. Then go to the following days, and study the days price action. Note what happened out of the Asian range, Look and see if you can see the templates in there, Put the traders trinity on a 4 hour chart, look for profit targets, if the 161 extension, 200 extension overlaps with a weekly/daily support or resistance level, was there a reversal? Study study study, notice the profit potential when you catch sell days, when the trend is down.
Man street money is not even looking at market flow. market flow? whats market flow? There market flow is that HUGE judas swing upwards that takes price just above the previous days high to blow out stops and trigger new buy orders, they buying thinking its breaking out and you selling.
You have to look at everything in context, My take is that if they see this huge down bar on the daily chart, then yes they chasing price, but they often chasing price when its nearing a key support level. Always keep your big levels in front of you. I mark them out everyday on a board, so I’m reminded all the time where they are. Remember you get all types of street money, not just guys who chase price but guys and girls who are looking at that overbought indicator looking for a reversal.
Start on the higher time frames, ICT says it day in, day out. He said in his video the other day that we look at the 15min chart to often. Well I was doing that. Studying pivots and looking for OTE’s.
The day i stopped doing that and started looking at the daily, 4 hour and 1 hour I began to understand WHERE price is. You begin to see that price is nearing a key support level, don’t look for shorts around there.
I also want to add to what Shaun and PM already discussed, with my point of analysis. When I looked at bond prices, all 3 had closed higher. I interpret this as a continuation for the USDX of the previous day, which for the NY session was down. I had also checked the weekly and monthly TT. Even though we had broken below the TT, I didn’t think there would be any way price was going to reach for extensions the day before a long weekend.
Based on that, I had a buy day in my mind and set an entry for 1.2890 on the Fiber, which was an OTE from yesterday’s low, as well as GMT S1.
I just thought of this as I was finishing, but I’m not sure if they need to gun stops and reverse price everyday like we have seen the last week. If enought street money is in short positions, wouldn’t the best way to get them out of the market be to just increase the prices?
Matty, I wouldn’t worry to much…if you have the basics down I think the videos still to come out will put it all together for you nicely…
Plus next year when ICT does all the analysis we will learn so much more…
I tried doing this, using SMT divergence to get me into a trade and I got burned.Use it as confirmation of the trade.
I’m going with the divergence that confirms my support or resistance level
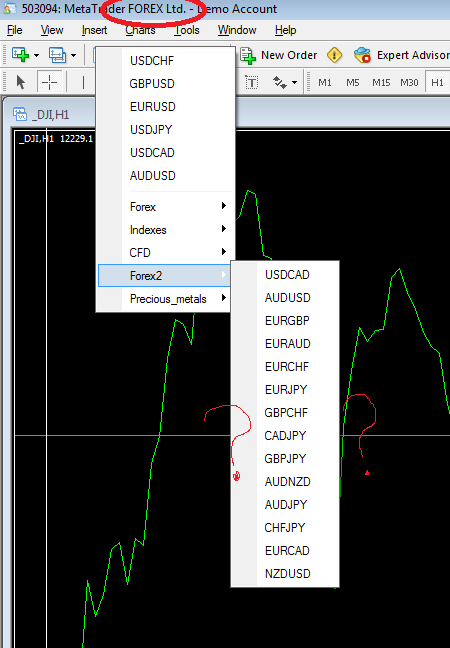
I really appreciate all your guys help here, so thank you. Also, I downloaded forex ltd off the first page, but can’t seem to find the USDX chart in it…thoughts?
Matty
Shaunnd, I dont’ think your link works…at least I can’t get it to work
Sorry, its my post from earlier on today, page 652
I also think so - they don’t necessarily have to gun stops in order to move higher - that’s like what happens on those massive range days where price just keeps going on and on and on in one direction, because there are always traders jumping in taking shorts when they believe that the market has reached a high at a resistance level. So price just goes higher looking for those sell orders.
Matty file->new chart->forex2-> USDX
Yeah Im not sure Judas is always about raiding stops–I think it can happen just to get the trend and momentum guys heading in the wrong direction, Im sure if they can kill two birds and take out some stops they will also…BUT…Its hard for me to really attribute any of the moves we saw today to market manipulation. I mean, maybe it is but I just think that considering how many people are off today we probably shouldnt look at today as representing anything “normal”. Just my opinion tho. However, all the really succesful traders I know, ICT included, are not and havent been trading all week–because weird stuff happens this time of year.
If you just use Judas swing as a way to determine bias for the day, don’t. It works just slightly over 50% of the times. I tried looking at a couple random months and that’s what I saw. I think when the rest of the videos are released it will become more clear. Also why not just chalk it up to a loss? I think if you win 55-65% of the time that is more than enough to meet any reasonable goals.
Also I found there to be bullish divergence within the asian session itself which I took to mean accumulation for longs.