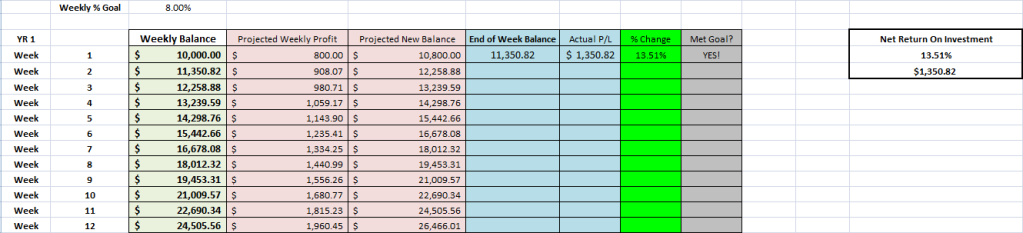
Additionally, I’ll try and post a weekly equity update like I started doing last year to help with my discipline and accountability per ICT. I topped off my account to $10k after reaching an equity high of $6,321.56 last year (from starting balance of $3000) and will be looking to earn 8% per week this year. Its a lofty goal, and I won’t be upset if I don’t reach it, but hey, you gotta have big goals right?
Sorry to be hogging the thread, but I have a question about stops. So with a lot of these concepts, we factor in where possible stops are and how banks would raid those stops. Well, how far back do we look for those stops. In my post above I marked a place where some possible stops might be, but I was looking at the lows made at the end of August. Are there really stops in that area still? The more I think about it, who would still have stops there? I can’t imagine anyone buying there and holding onto a position that moved up over 2000+ pips and then still have their stops below August’s lows. So is my thinking correct that there could be stops there, or no? Michael, and others, how far back are you looking for pockets of stops for the banks to raid?
You’re thinking of stops in a very literal way, as in, someone has a long position open and they have a trailing stop resting below a previous low.
Something to remember is that above or below significant highs/lows/ranges, there are also limit orders, or essentially buy and sell stops.
In a nutshell, by price clipping above or below significant highs / lows, it not only trips trailing stops, but also resting stop orders to get people into the market. That’s part of the reason the Judas Asian range swing works so well. It’s gets people into the market on the wrong side, not just stoping people out of the market.
So ask yourself at the highs and lows you’ve identified, if people would have new orders there to get them into the market one way or the other, along with resting stops.
stop raids will apply to every timeframe you look at whether is is 15 min, 1 hr, 4 hr, etc. This is what we are just starting to pick up on, the patterns are repeatable for every time period. Look back on page 702, the chart is a weekly chart, but looks as though it could be one day.
seems like sometimes they take out previous days high/low fractals on 1 hour, sometimes they take out the tiniest of swings on a 5 minute chart before shooting in the opposite direction. You can see this as sometimes the judas swing does not even leave the asian range whereas sometimes the judas swing itself is very huge.
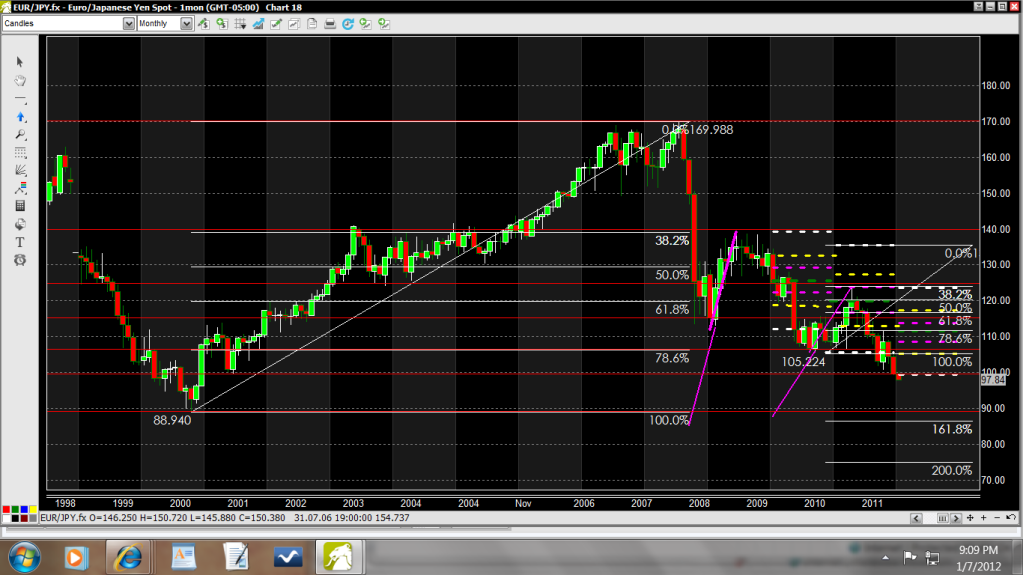
For my homework this week, I picked Eur/Yen, a pair I havent looked at in a long time. I went back a couple of weeks marked off weekly open, sunday range, the daily open, asian range, The daily 18/40ema’s, Kill zones, etc…This pair showed textbook behavior all week.
I started looking at the monthly chart and placed yearly TT on it…We opened the year in the buy zone, but Dec broke though the bottom of the TT…So I’m thinking price has a good probability to go down to the 161.8/200 fib line. I also measured the last two swings and projected that price has a good probability of going down and taking out the low from 2000. That’s about 1000 pips. Am I looking at this correctly? Did I measure the swings correctly (pink lines) If so, would the B.O.J. let this happen?
Thanks
Jack
Let me first say I have watched and rewatched the Open Access video from ICT multiple times, I can’t thank ICT enough for this information. I have my head held low when I say that the first time I watched it and he said. “If this doesn’t have you smiling then I have nothing for you”; I was one of those that didn’t smile at the time because I didn’t grasp the concept he was trying to teach. I do gotta say it takes we a couple of times to watch videos to grasp the concepts. I took notes and more notes and I think I have finally got my pin number for any, I mean any ATM…
Second I just want to say to everyone trying to predict where price might go needs to stop right now and relook over their trading plans. They need to first look for their entries and get them down packed then worry about where price might or might not go too. I have to say I was trapped in this mind set of trying to ask everyone where they thought price might go to and trying to predict where price will go, but I should have look at getting my entries down and then worry about where price might or might not go.
If you look at the RED arrow ICT says that the market flow is broken and now we look for sell weeks and look for any move higher for a sell program which I understand as the 3 fractals we see on the chart. Anytime after the fractals you always look for down weeks until market structure is broken to the upside. This I understand…
Now if you look at the WHITE arrow this is where ICT starts his analysis in the video. I can totally relate to everything he is saying in the video so long as I know market structure is bullish in this case.
Look at the ORANGE box with the fractal inside. If you are looking at market structure as a down move then this fractal high would get you in sync with the higher timeframe move down. If you count 3 bars to the right which the 3rd bar would be your week to look for a down week, you can see you can be wrong and this bar also is the fractal that ICT is talking about for market flow to turn bullish.
Now I don’t know how you can tell this market is bullish until the fractal in the orange box is broken to the upside, so why did ICT start with this fractal and say that the 3rd bar to the right we start looking for up weeks? Just because it’s a fractal?
To me if I didn’t see the rest of the chart I would think because the market structure wasn’t broken to the upside on the ORANGE box fractal I would be looking for down weeks until that fractal was broken. Now when do we stop looking for trading weeks in this direction? When the new fractal is created? If I would of started looking for down weeks on the fractal in the ORANGE box I would have had less down weeks then up weeks.
Did he start looking at this fractal because it bounced off a key support level?
Now what do you do when you are at the fractal at the bottom of the blue line? If you continue to look for down weeks until a new fractal is formed or market structure is broken, you would be wrong more then you were right…
I guess this is what I get when I over analysis ICT’s videos…
Anyone have any insight for me or can anyone SLAP me around and tell me what I am over thinking…
Without these questions in mind the Open Access video makes complete sense, but I always start looking around the chart and start looking at other possibilities for this to happen in, then I start coming up with questions after questions after questions…
Piphanger, to me, trying to determine WHERE prices is headed is much more important than WHEN my entry is. When I have a good idea of where price is going, then I can have a daily/weekly bias. If I have that, then I just wait for an judas swing, or buy/sell day template to play out, and that will give me my entry. In my mind, the entry is the LAST thing I worry about.
Yes you do need a bias on if you are going to be a bear or a bull, but you don’t need to know how far price will go in the direction. If your bias is a bear then look for an entry in that direction to get in the trade with good probability on your side.
You don’t need to know if price will make it to this level or not before you enter a trade. You enter a trade and manage it…
I guess to me I don’t want to look at price and say well I think price is going to go to x.xxxx and then find my entry…I think if you look at it this way then it’s to late to enter the trade…
Piphanger… when we use Market Flow… what timeframes do we use to determine a bias?
Daily - 4H - 1H right?
The Daily has broken Market Flow and in your chart where the white up arrow rests… look at the Daily and left a bit to your left… you will see the Support it retraced to and voila.
Don’t look for perfection… it won’t manifest no matter how hard you torture the data… you need the edge and that’s all.