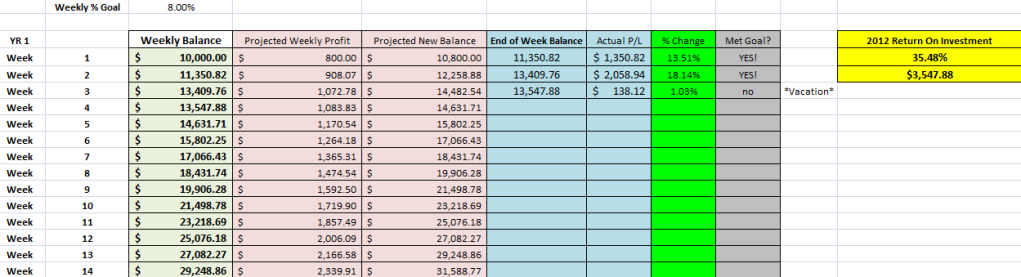
but I scale out of my trades, so the real result was closer to 8%
edit:
just to give you an idea of how that went… I had risk neutralized and was sitting on a winning trade within 30minutes of having pulled the trigger. Then I just sat and watched it, and the upmove was so powerful that I just decided that it might have good potential to fulfill the weekly range.
I guess what I meant by “horrible entry” was more on the mental side…before entering the trade I kind of second guessed my plan and left about 9 or 10 pips on the table… I’m not being greedy I just want to trust in my plan more when it comes time to pull the trigger… but that will all come in time…:57:
I haven’t seen anyone post the LO trade for today, so here it is.
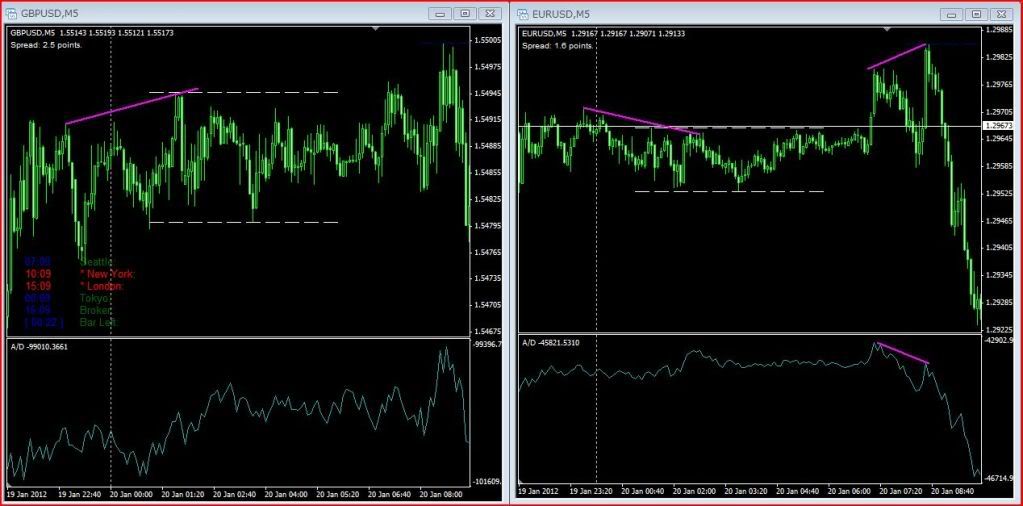
S&R at the 1.2970 area, H4 OTE 79% (Jan 3rd) and H4 OTE 62% Fib (21st Dec) confluence at the 80 Institutional level. Weekly R2 Pivot. Divergence of highs during Asian Range, and Divergence on Fiber at the Open (A/D Indy). Judas above AR highs to ‘goat in’ the Street Money…down she goes.
Was watching the exact same thing. There was also some strong Resistance levels (previous week high on cable, I believe -not at my charts- and some other strong R levels on the daily).
As with you RC24, I was watching and saw it all unfold as expected, but did not take the trade as I already took my one shot this week. Nice to know when you are starting to have the ability to anticipate the movements though!
Well I finished off the week totally flat. Was ready to short LO today. I had 2980 and 5500 marked on my charts last night. Set my alarm for LO and went to bed. The alarm didn’t wake me up and I missed my 1 shot, 1 kill trade. This week was definitely a test of my patience and i’ll be finishing it without 1 trade taken. It wasn’t a losing week tho so i can’t complain.
Check out ICT’s Livestream videos…it is in one of the latter ones. Divergence highlights the Smart Money distributing into the rally. I wasn’t using it today but a friend pointed out the divergence to me and so I included it.
It was a difficult week for me. I had a hard time identifying SMT divergence. I couldn’t figure out if it was bullish or bearish most of the time. So this weekend I’ll go over the SMT, LO, and S&R videos again, clean my charts and start fresh next week. Have a good weekend everyone!
I’ll be sure to watch it…but it’s pretty cool to pretty much know what’s going to be said in advance.
Classic Buy Day with the profit release during NYO. Stop raid above the Asian range with a 8 pip reach above the AR high to the 1.5500 figure. Then a judas swing down to the AR high from yesterday. Also had confluence of the 1.5450 and MS1 level here (the dotted white line is MS1…the red line is yesterday’s AR high). Then the profit release during NYO and reached for R2.
A textbook buy day from MS1 to R2. While easy to see now…it would have been tough to trade it. NYO profit releases can cause fakeouts. During LO…you thought you were in the profit release and price was heading down. I guess the “Market Reversal Profile” is what really covers this. A NYO profit release can turn what you thought was the day trend and make it look like a judas swing in hindsight.
Hopefully ICT gives some tips on anticipating a reveral profile and trading it. Clearly, would have been profitable trading the LO short. But it stopped and reversed pretty quick. Easy to see now of course.
Now…while it’s easy to see the buy day on the GU…the EU was a little trickier. It was a sell day. Judas swing up to the OTE entry points that was highlighted a few posts down. In addition to the confluence on institutional level, and OTE…this was also the 138% extension of the TT.
After reaching that high, EU sold off and stayed below the AR all day.
Right now, have significant bearish divergence heading into next week. GU had an up day, while EU was down. Will be interesting to see where Monday swing in relation to the opening price.
Hey guys. I’m back from Mexico. Nice relaxing week…but ready to get back to the markets. BTW El Dorado Maroma is a freaking AMAZING resort, if you are ever headed down to the Riviera Maya. Best beach I’ve ever been at…
Anyways, got back last evening and slipped in one quick scalp today. Looking forward to a great week of trading next week. Here’s my weekly update even though not much has changed.
For everyone else, I have a question regarding market flow. I understand all of the ICT tools, but this one, as simple as it seems, is giving me trouble. I know that you just look at the last two fractals to determine market structure. In the link below I have a small pic of a daily chart with fractals…
Assuming we are looking just in the red box and that today is the bar with the yellow line, how would you interpret this? Then, when price breaks above the last high fractal, how would you interpret this? And finally, when that new high fractal forms, how do you interpret that?
I look forward to all responses since this is one technique that has been bothering me, even after reviewing the slides.
Because of today, there is SMT divergence between fiber and cable. Cable making higher highs while Fiber making lower highs. Could be interesting to see a decline come Sunday!
Looking at Cable, I’ve been watching the 1.5580 level as it seems to be a decent S/R level that we’re trading up into (prior support becomes resistance once broken):
Now, obviously price can do whatever it wants as we head into the weekend. We can open up way above this level or way below this level, so I’m not glued/stuck to this analysis by any means. We did trade much higher since LC today. Bullish days everyday this week on Cable…
I’m looking forward to what Sunday/Monday price action looks like; this could change things significantly.