Count me in here. Got stopped out yesterday New York Open. Was planning to go long on the Cable since market flow was up on the 4H and Daily. It also looked to me like price had broken through previous highs and then was retracing to test the previous highs at the 1.6270 S/R level which coincided with my optimal entry and CPP. Too bad price didn’t stop and broke all the way down.
Well, can’t win them all, right? I’m proud that I was able to stop myself from entering into another trade that day (though I was sorely tempted to try to recover some of my losses). I just kept reminding myself that there will be lots of other days and setups to come so rather than rush into another trade, I simply watched from the sidelines.
Took the same long on fiber.
Saw MF was up, and we got OTE around MS1.
Took some profit at the 1.64 figure, and left some open to try for R2, but didn’t quite get there. Still, a nice profitable trade.
As a side note, I’ve been trading live with these tools for a total of seven trading days now. [B]I have not had a single losing trade[/B] (a couple of break-evens due to tightening stops too quickly), and [B]my account is up roughly 65%.[/B] I know a losing trade is coming, but with this kind of expectancy, it really doesn’t bother me.
I don’t give those figures in order to boast, but to show that this stuff really is working, LIVE, exactly as ICT said it would, and to give hope to others who (like me) may have been close to giving up any hope of making consistent profits in FX.
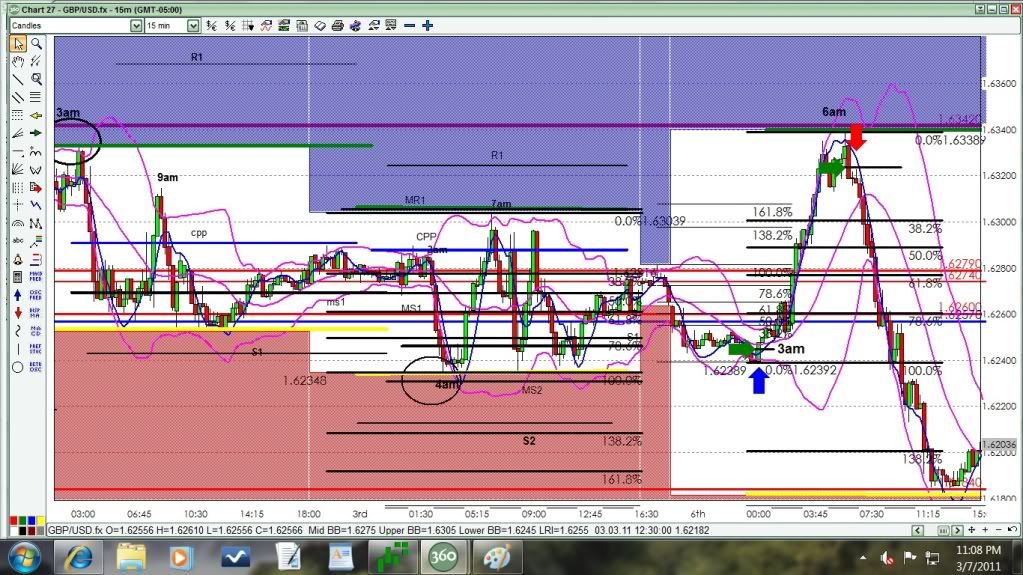
I would like to post how I saw Sunday night/Monday GU trades I took. I apologize for the poor quality of my chart. I am not very computer savy. This is the best 2 trades I have ever taken and am very excited!!. Please let me know if I am looking at things correctly.
1st trade - Sunday at approx Midnight NY time. Took long at 1.6244
Reasons for the Trade 1. Below daily CPP in the buy zone. 2. Confluence of PDL (Friday), Fridays MS2, Thursdays S1 and 78.8% fib from Fridays low to high. 3. This one is from Tymen’s BB DNA thread - 15m TF was in a Boll Band squeeze and I entered on the Count back line rules from that method.
TP1 at 30 pips. TP2 set at Fib ext 161.8% from sunday high to midnight low which converged with Fridays PDH and took TP2 at round number 1.6300 for 55 pips. All while I slept!!!
2nd trade - when I woke up at 6am NY time. Saw price above CPP in the sell zone
Reasons for trade: 1. Convergence of PWH, Fridays R1, Thursdays High 2. Entered at the rules for BB Countback line at 1.6324.
TP1 = 30 pips
TP2 at convergence of Fridays S2, Fridays Fib ext 138.2% and Sunday/monday fib ext 138.2% and institutional level 1.6220. 100 pips.
Total for sunday/monday approx 215 pips.
Thanks so much for this tread!!!
I am done for the week, since I can only trade part-time
This is good to hear:) I’m going live next week myself. Consistently making fake money is depressing, ya know?
Leaving to Hawaii for a week here, first, though. Felt pretty damn good to grab cash for the trip and exchange what Americans used to consider monopoly dollars 1:1 with USD.
So, yesterday didn’t go so hot. Ended up around -50 pips off of two trades. Today should be better, I’m thinking.
So, we’re entering the new day after some pretty decent consolidation in the Asian session. I know we’re in the sell zone, but my initial bias is short, due to the giant bear flag that price has formed. That may change to long later tonight.
Currently price is hung up on MS1 for the day. I’m expecting price to trade up to the CPP, or possibly MR1 and then continue it’s move southwards.
For Confluence at the CPP, we have:
Daily CPP
Yesterday’s MS1 and S1 both within 10 pips, with yesterday’s S1 being tested as resistance earlier on today
We also have the institutional 1.6250 level nearby
the 32% retracement from PDL to PDH.
Total: 4-5 events.
For confluence at MR1, we have:
Daily MR1
Yesterday’s CPP (which also acted as both support and resistance yesterday)
the 62% fib drawn from PDH to PDL.
Total: 3 events.
Also, If you guys could post the values of your ADR high and low. I think I have to futz around with the settings for mine a bit more.
My ADR high today is 1.63230, and my ADR low is 1.60790. Is this right, or are people getting other values? I’d hate to be using ADR incorrectly.
So, ignoring the last 3 candles there (the “after the fact” candles), I saw price in the buy zone, right at London open. Price reached just past Asian low, into S1, where it spiked through and the formed a hammer. There was also yesterday’s untested S1 there to act as further support, and it was right at the 1.3950 level. Seemed like a loaded long, so I went long.
Unfortunately, price tested the Asian lows, and wasn’t able to break through, leaving me with a net loss of -21.5 pips.
Total for the week: -75 pips or so.
Well, I’m off to bed, we’ll see what New York brings me!
Didn’t find any good setups around the open, so I stayed flat.
I actually monitor several pairs, and couldn’t find OTE with any significant confluence on any of them.
I will wait for NY open and have a look, but if I don’t find anything, it’s an early night for me
ICT, I was wondering how you feel about taking trades where there is a good confluence, but we don’t have OTE? Just how critical is the OTE, in your opinion?
If you trade against a Sovereign you will lose, regardless of how many lines, fibs, indies ect. you have on your charts.
If Sovereigns are on the Bid and Offer…the retail crowd is taken to the cleaners on both sides of the trade.
They are flushing the retail crowd between 1.6170 and 1.6210/15/20 in Cable since Frankfurt Open this morning.
The Sovereigns WILL win…ALWAYS…you don’t stand a chance against them if you are on the wrong side or caught in the middle.
Aarnog my ADR is H-1.6283 to L-1.6094, I haven’t touched the settings so I think this is 5 day default.
I had 2 losers myself yesterday, I’m still having difficulty sitting on my hands so I entered a small position, long at the Asian low, which I’ll leave for a day or two if it’s not stopped (level looks to be retesting now). I’m hoping the length of consolidation may somewhat invalidate the bear flag (Cable btw) and NY sees the GBP as undervalued.
I’m a bit bullish on Fiber but don’t see any value in being in both cable and fiber. Fiber is approaching R2 and the 1.3900 but unless NY open brings an OTE I’m staying flat.
Staying out of the market when it is a little flat, or there are no perfect setups, is one of the hardest aspects of trading. Once I cracked staying out and waiting for a better setup I became consistent almost immediately. Overtrading can cloud the results of an otherwise effective strategy. Anyway, sorry to interrupt, thought it a point worth making!
I hear you ST and I believe you. I’m a disciplined person in [I][I]real life[/I][/I] (gym in 10 minutes even with the sniffles:mad:). I know I’ll get there with trading but I’ve just got to make that mental leap. Discipline, patience etc. is plastered all over my notes but I’m not following through yet. Might have to go cold turkey. Cheers.
Aarnog, I was seeing the same things you were last night. Price might keep going south…To add to your analyis I’m looking at the H4 TF and if you draw a fib from low a week ago Friday at 1.6030 to last weeks high of 1.6342 the OTE I see setting up here is at the 78.6% at institutional level 1.61000 also a big round number and at the H4 200SMA. This is where I will start looking for a long. THanks Jack
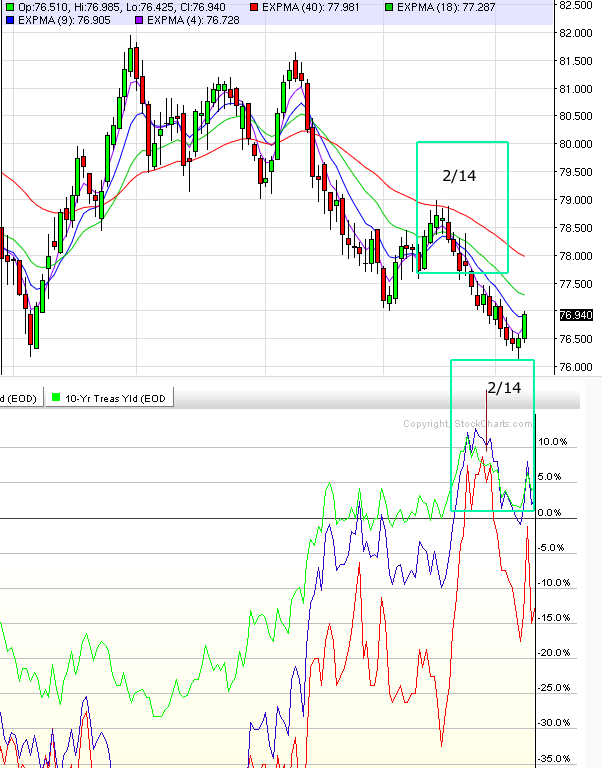
Top picture is the USDX daily, bottom picture is a combined overlay of the 2/5/10 year note. The green circled box is the same period on both charts. On the Treasury chart there was a divergence between the 2/4 year bond. The 2 year went short while the 10 and 5 continued up. ICT can you comment, is this the type of setup you want to see when anticipating a possible change in the USD index.
on 2/14 USD index started going down, 2 year treasury went short and the 10/5 year were heading long. Afterwards the 5/10 followed suit of the 2 year in moving shorter.
I totally forgot to mention in my post - I went long on the Fiber, not the Cable. The Cable really looked like a death trap today, so I stayed well away from it all day.
The Fiber was actually looking pretty decent for a long. At the time I entered the trade, Market flow was up on all 3 time frames, I was in the buy zone, plus the other technicals I mentioned. I figured price was just going on a stop raid. Ah well, win some, lose some.
Also, I noticed that the low of today on the Fiber was exactly on January’s high. I imagine that if we break that level, we’re in for a pretty significant bearish move.
If you look carefully, the 2:30-2:45 candle broke below the last 4 hour fractal as well as the 1 hour fractal, turning market flow bearish on those 2 time frames. Price also broke the Asian range to the downside, which then acted as resistance on the 3:00-3:15 candle.
Hm, I did miss the break of the 4h fractal on that candle - I did notice the Previous daily low acting as resistance, though. I thought price would have been able to break through it though. I was wrong!
The Cable really looked like a death trap today, so I stayed well away from it all day.
Cable will continue to look that way until the 1.6050 and 1.6350 China Barrier Option “play” has been completed.
Cable’s 1.6341 level plunge was part of that “play”.
Also, I noticed that the low of today on the Fiber was exactly on January’s high.
The 1.3864 holds weight, yes. Nov 1st, 2010 weekly lo, Jan 2011 hi with 1.3860 Jan 29th, 2010 weekly lo below.
If Dollar Index breaks important 77.00 resistance we migt be looking at Fiber weakening further…mind you…watch those Sovereigns buying the dips and selling the rallies
How does one know when the “play” expires? I take it these are rumors…where does one find these rumors about what “Option Play” is in play? I’m googling stuff but it’s still a bit over my head. It’s great you brought it all up…perhaps a good topic to teach more about it and how it affects spot forex.
Look at your charts. Seriously.
If price “all of a sudden” turns away a couple of pips below/above a half number/round number or big figure…a Barrier Option Structure is in place and ACTIVE.
1.6343…the first time last week…1.6341…yesterday.
Now they are gunning for 1.6050 Barrier with Stops below 1.6160 being flushed, today. Today’s close…1.6158.
Next Stop targets they are looking for…1.6114/00…after that it’s 1.6088/84/74/68. If they trip those STOPS they will put Bids above 1.6050 to defend that level.
I take it these are rumors…
They aren’t. The finer Barrier Option Structure details are not known except to the two parties involved but that they are active is known. Especially Cable because the levels are repetitive where the “plays” are active.
Watch how Cable price action changes the minute 1.6050 is taken out…
where does one find these rumors about what “Option Play” is in play?
Seconded. Can you elaborate or point us towards further study areas please coxsonne. I’m Ok following the basic news releases and forex calender info. but commercials and institutional moves, well, I can’t even find out where to learn about them. I’ve had two good looking setups blown away by stop runs that both yourself and ICT seemed to see brewing. There may be more on these things to come but any help at this point would be most welcome.