Hi! I just read the art of the trade, and must say it was a great book! though it will take some time to digest it =]
Finding the loser intrigued me, and I started thinking about it, and still am… where is the losers? the 95%…
I started thinking about where I myself lose all the time, where my SL get eaten all the time, and what would happen if I switch it around and start trading where I used to put my own SL… Someone is winning where my SL is, I want to be that guy. Indicators… when the indicators fail, thats when people who thrust them lose.
You guys should read it, its well written and funny sometimes. Cheers for recommending that Rel
Sorry , i have been away for quite sometime… Will try to catch up.
Btw , i see your point here… And it really makes sense.
Just by saying this much , i can tell you have “Really turned your trading around”.
Why today the price doesnt retrace much to apply the 20 pips down… it keeps on making new high…how to enter Rel? how to recognize the continuation pattern…
I really do not know how to see and conclude these stat data…pls CF xplain in details on how to analyse that…and relation to the chart…I just dont know how…just like a mouse seeing an iron…:37:
For the stat…I could see that the M30 and M60 of avg wick and body share same value…I dont know why…
and the chart is just swing hi and low… thats all I could see for now…damn blur…
What body means - The strength in the direction of the candle. [ Or Direciton of trend?]
What wick means - The strength opposite to the direction of the candle
Higher the Rangetobody ratio , Greater the strength in the current direction.
Lower the Rangetowick ratio, Greater the strength in the opposite direction of the candle.
I was thinking why bodyto wick ratio is not there?
And the wick, can be in both the directions… So the explanation i have given is not correct… Am i missing something?
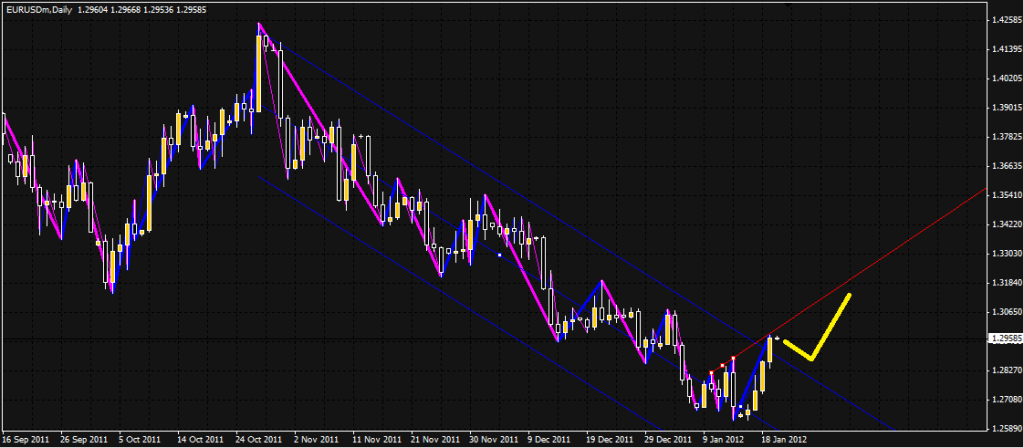
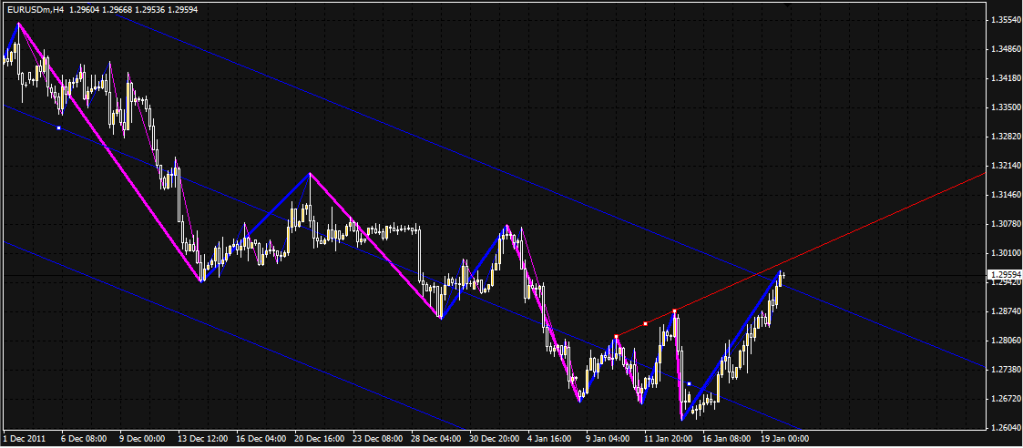
so kay in the 5hr chart we see that there is a bit of a resistance left over from the last two peaks at the daily time frame and it seems to have bounced off that resistance, though it is more likely that people stopped buying for a bit as price has been going up for a while and there’s not THAT many people selling as they think that price might go up higher so people wanna hold on to their euro’s before they sell it for usd. at this point it seems like theres gonna be a retracement as people “catch their breath” and it might bounce off the previous downward channel’s resistance-turned-support.
1hr focus
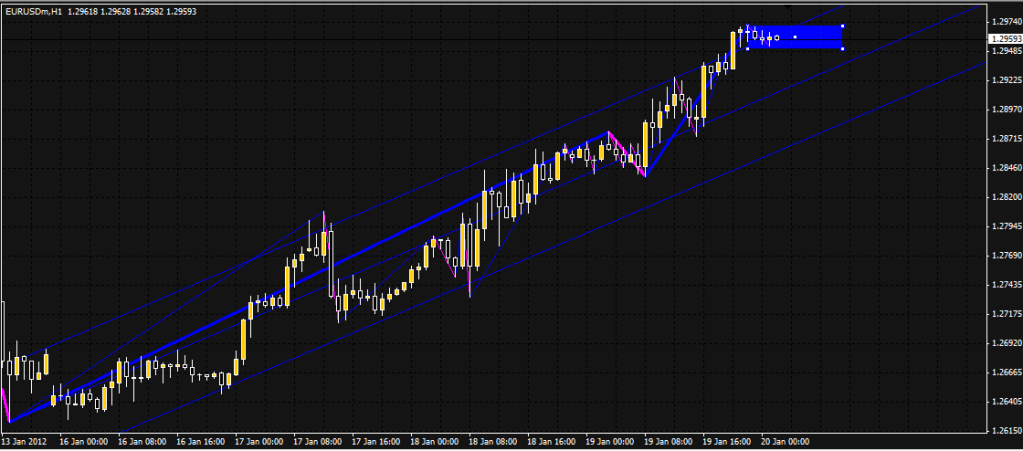
Looking closer in to the 1 hr chart, we see price has stayed within the 20 pip box for the past few hours my plan is to put respective sell and buy orders at the bottom and top of the box ( on the outside maybe 5-10 pips away) so as to catch the trend with 25 pip trailing S/L. we see that price has sort of come out and back in the channel though not really sure wether I should move the channel thing to the next extreme? (please answer rel cause I remember reading that you said to ignore the latest swing when drawing the channels so yeah )
General Conclusions:
Price will either shoot up in the next few hours ( around 60 pips) untill it reaches the rising resistance of the last two swing high’s, though the resistance isn’t really strong as it hasnt been confirmed a lot, will try to play a bounce off that if it happens if not it might break through since its not strong and the upward momentum seems to be pretty strong. A retracement seems “due” when you zoom out a bit on the 5hr chart or go to the daily chart this last swing high looks to have confirmed the resistance, and the path of least resistance seems gentle retracement parallel to the previous channel resistance-turned-support and then another strong jump UP as is shown in this last picture
PLEASE comment and tell me what you think of this analysis and what you think of these charts : )
ps:it wouldnt let me embed the photos for some reason : ( it kept saying invalid url I unchecked the box below it and it worked to put it in the message, and it wont let me post the link cause i dont have enough posts BUT anyways hope it works
Keep working on it. You will eventually find that you can simplify it down way more => But when you get there, you should find yourself understanding PA very very well.
Regarding ignoring the current wave; its an old rule until I found Linear Regression Channels worked better, since they account for both inside and normal swings, making things way easier. Just apply onto D1 swings (both previous swing and current swing), from extreme to extreme. Be careful about the current swing, not to apply from extreme to close.
wohho…just came back from funeral. One of my schoolmate had passed away due to heart attack at age 41…
Thanks CF for good visual xplanation. Just need to ask you to show how are we measuring the 20 pips matter from the visual chart shown?.
hmm…I think I got it from the latest diagram !..
Hi guys,
been busy last days, so I wasn’t into the thread
See you’ve made a lot of work…
Iìve some questions, and something to point out.
REL: it’s about standard MAs, or GMMAs too? In this case, how can we review and finetune GMMAs settings…?
Look @ my chart: 2 classical examples of SL hunting today, exactly where REL said: Price Extremes + News
REL You said in this image we can trade both ways, accordingly with 20 pips rule, but, in real practice, I saw too many whipshaws regarding this… also if I understood the rationale about it, too many times price retraces >20 pips. close below or above the 20 pips box, but then makes few pips, and goes back to take SL… Yesterday’s EU chart was an example… (see my next post)
Regarding this chart below, you said that with the use of LREG Channel, we can take in account the last 5H wave. But, we can see today EU broke Lreg Channel & then bounced back inside for > 60 pips… ( EDIT: price went again inside after I made this image)So, isn’t so safe jumping in as soon as the channel is broken…
[B]20 pips rule:[/B] 5 examples marked in my chart where 20 pips didn’t work.
Also if we go for just 1:1 RR Ratio, and use 20 pips SL…
So, I think we have to understand something more about it…coz. 5 times in a row, the same day, isn’t a good thing, also with good Money Management…
P.s. I forgot the down move just before the last I drew in my chart. But it was about 52 pips. The clos below 20 pips zone was about 29 pips… considering spread, not every people could have got 20 pips…

 cause I remember reading that you said to ignore the latest swing when drawing the channels so yeah )