R:R means Reward:Risk in this case? (cause usally means Risk:Reward)
If we are in a trade, and we get an opposite channel break before we reach our target, we exit the trade or we look @ higher TFs direction to decide what to do?
Ok, I’ll remove HA candles later,
now just trying to upload image from tynipic…
Maybe, Market gave me the answer… ROFL
I wasn’t @ the screen… went back home and saw this… What’s happened? No news scheduled today… Anyway, if one misses this kind of break, can never enter on a pullback from older trendline…
It’s going to break (it has to… )
But it broke down, and up and down again…
Anyway (just to try) I went short 1 pip below first candle which broke down, but doesn’t seems to have been a good idea until now…
Edit: Closed the trade @ about 1:1 R:R
I have to become braver…
What do you think about the Eur/jpy now? 0207 +1gmt, I’m just about itching to grab it, using the tips ive gotten from this tread. Looks sexy on the longer weekly timeframe.
I’m starting to get a different mindset about the whole thing, and I must say this feels more comfortable.
I have been getting some nice entry now, but struggle some with the exit strategy. I find it difficult to read if I should take this 40 or maybe wait for 60 and beyond. Is there some signs you look for that the price is ripe?
Also when a 1h/1day wick is 20 pip long, and you are in… do you make stoploss 20 pip also? I my initial thought about that is that its an easy SL to get whipsawed.
Also say you cant be at the computer or need sleep, do you then set SL/TP at 20/40 to be safe? a 1:2 r:r, or would 1:1 make more sense
I’ve some questions about this issue and others, just to point out better what we learned until now.
First of all, thanks to your words and Barros Indi, we can now define better a trend and have a clearer vision of price movements in all Tfs. We can now draw the right trendlines and channels, so we can better know if price is changing its way.
Now, when we speak about Breaks and Bounce we should define better what is a real break and what we can call a bounce.
For me, trading the breaks of 15 Min Channel, break is when a 5 min candle closes outside thet channel. My entry is 1 pip above/below the high/low of that candle. Is this correct? (of course we must pay attention to higher Tfs channels, to not taking a break which can bounce on them a few pips later)
If we have a break of higher Tfs channel, we can do the same? Or it’s different?
Then (in all Tfs), how can we identify false breaks? Must we enter a trade every time we see a break?
Regarding Bounces: how can we define a bounce? Many times, price bounces on a trendline for a few pips, making also a candle pattern (pin bar, engulfing, etc.) but then stops there and or goes the opposite direction…
Regarding the 20 pips rule: Must we enter each time we have a 20 pips bounce from min/max of the day? We enter directly or must we have a channel break to confirm? We always go for 20 SL & 40/60 TP?
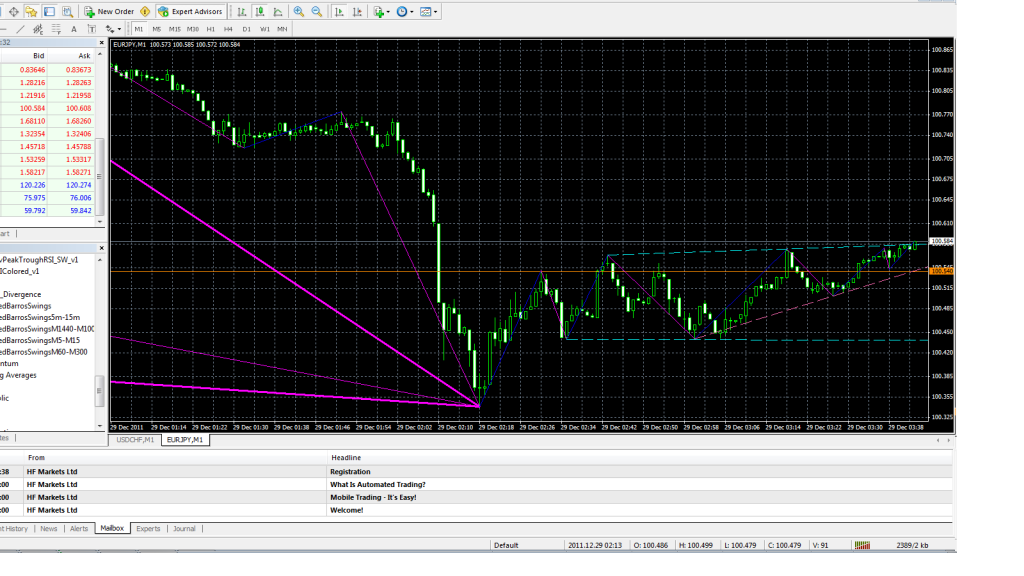
Here is what I meant… EU this evening…
Price retraced > 20 pips from daily high then went sideways for a while. When I saw the chart it was just breaking the lower trendline of 15 min channel. Candle closed below it @ 1.29402 (21:50 GMT +2 in my chart)… I went short 1 pip below. Price hit SL @ 1.29616 (previous high +1 pip + spread)
Where was I wrong?
I post 2 charts to see better.
p.s. where I wrote “Barros Blu line etc…” there were 1H & 5H too
Hmmm so from what I am understanding everytime a wall (resist/support) is tested or prodded, makes it stronger. And a strong wall will often give a powerful bounce, rather than a weak wall that often get hugged and eventually slowly penetrated. That makes sense to me as a proven strong (support) wall will have a confident lot of buyers.
So if your money is jammed in between a support and a resist, as long as you know the support is stronger than the resist (if you wanna go up) you can chill out and wait for the inevitable, and the only factor you really need to keep an eye on now is the news.
Also your thoughts on staying with the wall, and not bringing SL on the other side makes sense aswell, because all you do is potensially end up putting your money on the other side of the that strong wall, that now changed into a powerful support and can work against you.
Ahhh i learn so much! cheers Let me know if I got the wrong ideas!
Last job for this bloody 2011 (at least for me and many other people in the world)… hope the next will be better, also if, generally speaking, the premises are not so good.
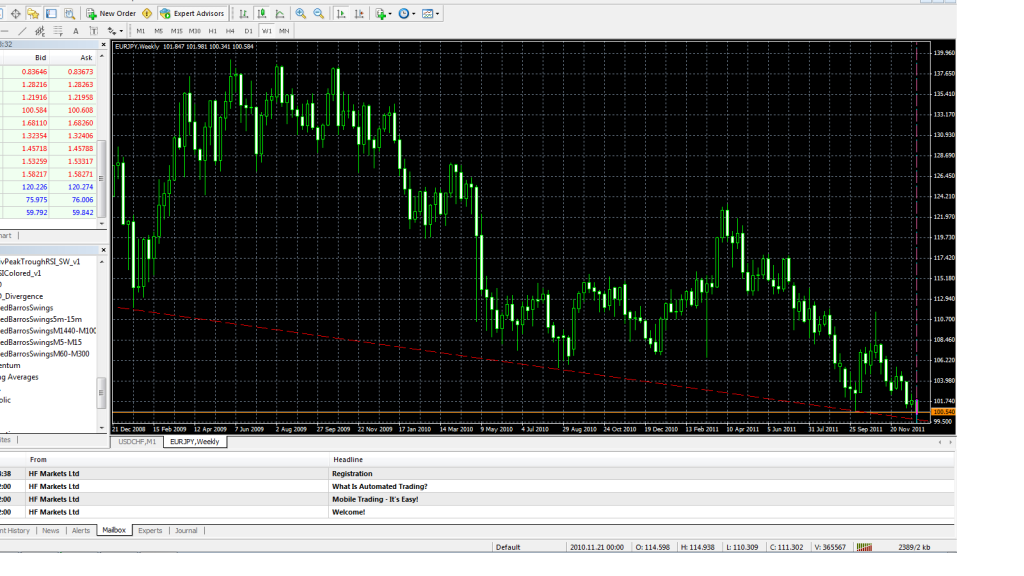
Anyway, I did my homework about EU. So, I marked the Montly, Weekly(Blue & Pink), Daily & 5H Swings (Green & White) .
Marked key levels of Montly & Weekly too (Fat horizontal lines= Montly, Slim horizontal = Weekly). I didn’t mark daily horiz. levels because the chart would have been only made by horizontal lines…
So, we are now on ascending leg of a donward Daily Channel after a bounce @ Montly support (low of Jan 2010) broken for just 15/20 pips. The Daily Channel is narrowing & we are in the middle of donward widening Weekly Channel. I.e. something must happen…
First of all I’d like to know if I made everything in the right way or if I missed something. Then, in your experience, what do you think will happen? What will let us know if price will travel up or down for a while?
Do you think it’s useful taking care of thinghs such as COT Index (Currently heavily long on USD and short on EUR) and Futures Settlement?
Regarding this one, I’ve read once (I don’t remember where) that futures settlement can tell us the future direction of price: e.g. if the June > March, then the general tendency for the next months is bullish & vice versa. In this case, EU will be bullish & Au will be bearish…
Maybe this regards carry trading? If I don’t make confusion, when economical turbolences affects the market, investors stays away from carry trading. This would be confirmed by the bearish settlement of AU…?
Ok… it’s enough for this year!
Thanks again for your help & many, many green pips for us all! :41:
We go for short @ a bounce from upper trendline of the daily channel, or we wait for a break of bottom line (because of the weekly channel pointing donward)?
Or, (maybe I misunderstood)… we just wait for a break by the weekly traders…i.e. regardless of the direction because there’s a lot of space in each direction…?
Maybe I still haven’t understood carry trading, but it regards earning money from the positive swap when there’s a big difference in interest rates of 2 currencies… So, when we buy AUDUSD we have a positive swap due to 4,25% vs 0,25% of interest rates. If you say to stay away from carry trade for now, but short EURAUD, you’re telling me to go long on AUD… so…it’s carry trading, because we have positive swap shorting EURAUD due to 1% vs 4,5%…
I’ve never seen those ma’s on your charts… When do you use them?
Default setting in your barros indi is m12 while you stated it was m15 on the wave 2 on your previous post (#83). Is it meant to be drawn on 15 min chart?
I am confused with the term H5 while there is only H4 tf on MT4 platform.
I think i missed something but can’t find anywhere here to clarify the confusion… pls advice.
btw…i’m from mlysia.
Very nice thread started by you. Will be seeing you more often.
While the pairs i closely track Have “USD” in it… Because my timings are comfortable and every commodity is denoted in $$$.
Having said that.
Here is a chart which compares strength of Currencies with respect to USD.
From the chart,
USD is weak against JPY & AUD
USD is strong against GBP,EUR
USD is “OK” against CHF & CAD
So from this what we can tell is that…
If we want to short, USDJPY is the best bet!
If we want to go long, AUDUSD is the best bet!
What do you say Relativity?
I have shown a red circle in GBPUSD & EURUSD.
We can see the oppurunity to go Long in GBPUSD … When all the other “USD” related pairs have shown movement.
By seeing EURGGP chart… we can see the oppurtunity very clearly…
Wondering if you would take the trade given the oppurtunity.
Will see you around Relativiy, By discussions our learning curve may improve to heights unimaginable


