Good evening, everyone. I apologize for jumping into this discussion, which started several months ago, but I would like to share some information derived from my studies.
The Ichimoku Kinko Hyo indicator (whose name means “equilibrium chart/table at a glance” - the concept of equilibrium/disequilibrium between price and the lines is closely related to the calculation formulas of the lines, which are NOT moving averages) that people commonly see on various trading platforms is only a part of the Ichimoku system created by Goichi Hosoda. The system, in addition to the indicator composed of five lines (Tenkan-Sen, Kijun-Sen, Senkou Span A, Senkou Span B, Chikou Span), also includes three theories (which very few people in the West are familiar with):
- Time Theory (or Cycle Theory, which helps identify the so-called Henka-bi, or “day of change”);
- Wave Theory (which describes price movements based on wave patterns);
- Price Theory (which calculates the potential extension of those wave movements to identify possible targets).
Ichimoku is a system that is at the same time:
- Simple, because, as some of you have already mentioned, it has visual elements that allow traders to quickly grasp the overall situation of an asset (not coincidentally, the name itself contains the phrase “at a glance”);
- Complex, because it is not just about buying/selling when the price breaks above/below the Kumo (the so-called “cloud,” which the creator never actually called that, but rather “resistance area”) or when the Tenkan-Sen and Kijun-Sen cross. Not at all! It is a system that requires its various components and theories to be used together in a holistic manner;
- Complete, because it does not require additional indicators or tools, as it already includes elements of analysis regarding price movements, momentum, and, most importantly, time (in fact, it also incorporates concepts from other theories, such as Elliott and Wyckoff, which, in my view, are universal concepts that different authors have simply named differently).
The issue with Ichimoku is that its true essence is very little known, mainly because the original books written by Hosoda are difficult to find and read. As a result, especially in the West, the various authors who have attempted to spread its knowledge have often limited themselves to providing their very personal interpretation and adaptation of the system to make it more “digestible” for their Western audience.
For the record, I am Italian.
Now, regarding the discussion about Ichimoku, moving averages, and the Donchian Channel, I will keep my words brief in the hope of reaching a consensus and providing clarity.
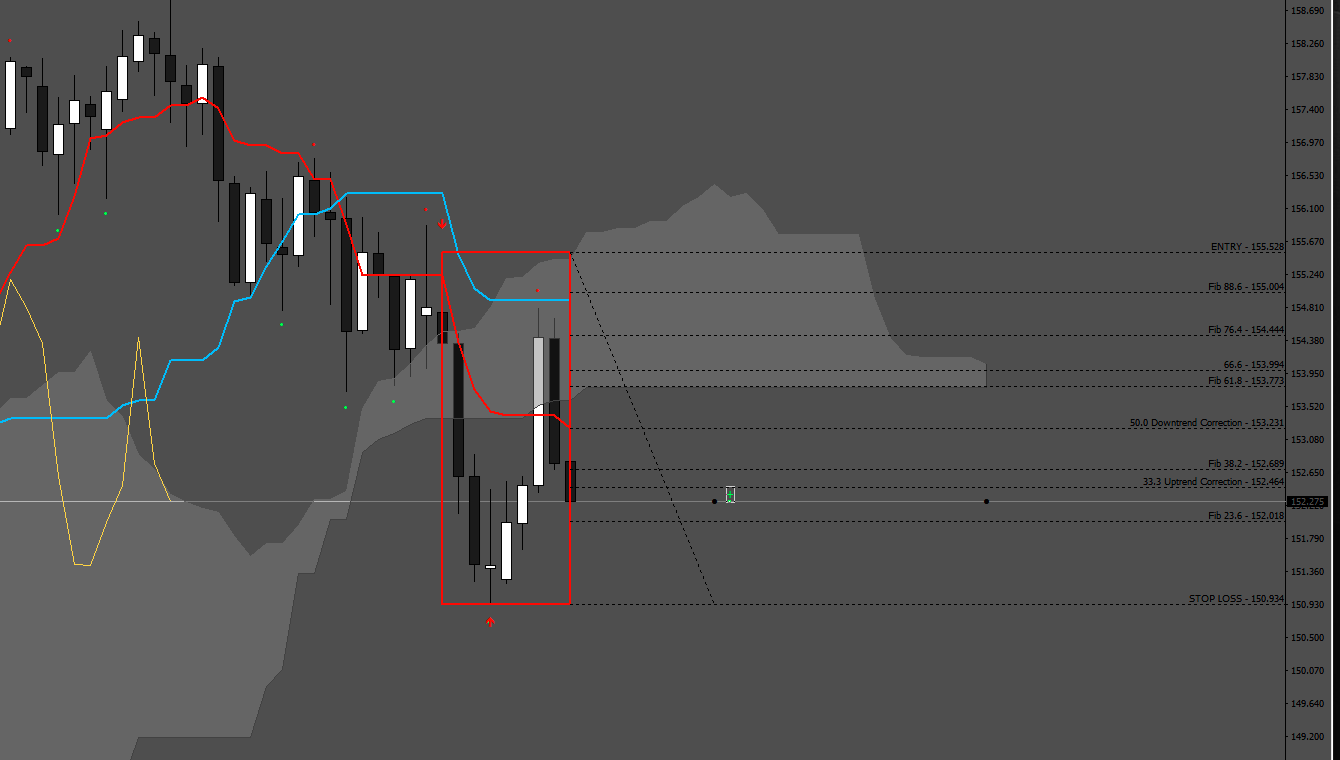
In the image above, you can see a red rectangle enclosing the last nine candles. There are two red arrows pointing to the highest and lowest prices reached within these nine candles. The formula to calculate, for example, the Tenkan-Sen is:
(Highest price of the last 9 candles + Lowest price of the last 9 candles) / 2
I added Fibonacci to show that the 50% level between the aforementioned high and low coincides with the Tenkan-Sen.
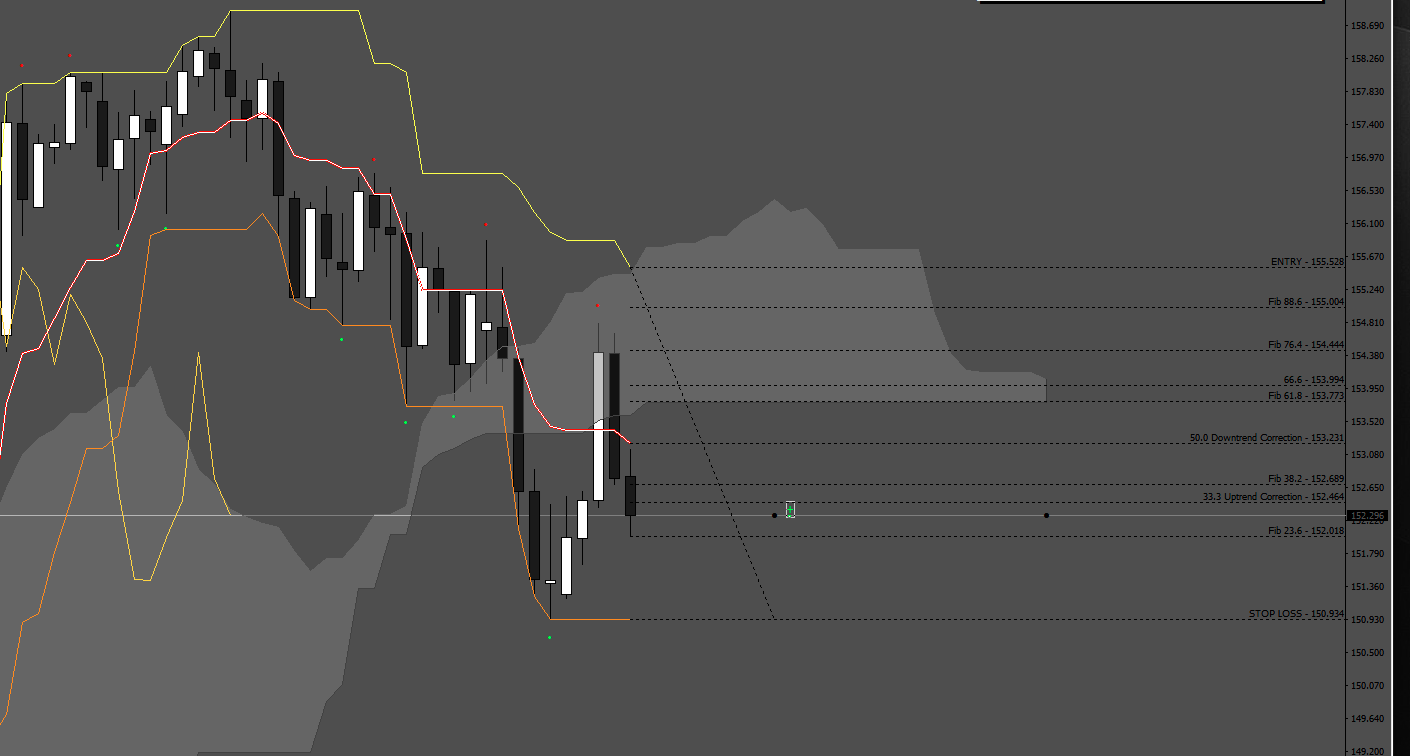
In contrast, the calculation for a 9-period Simple Moving Average (SMA) based on the closing price is:
(Close from 9 candles ago + Close from 8 candles ago + Close from 7 candles ago + Close from 6 candles ago + etc…) / 9
Now that you can see them written in black and white, you can tell that these are two very different calculations. Even if the two resulting lines may appear similar, their differences can be significant within the Ichimoku system. For example, an SMA will rarely take on a flat shape, whereas an Ichimoku line can, and when it does, it has a specific meaning and a possible specific consequence.