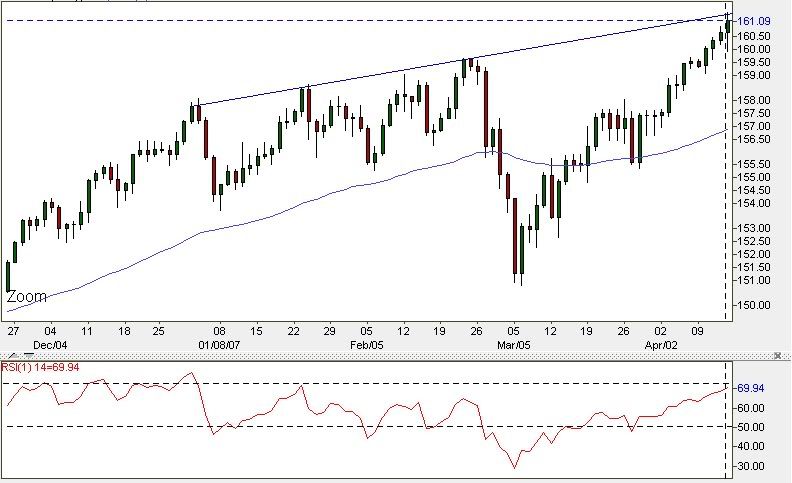
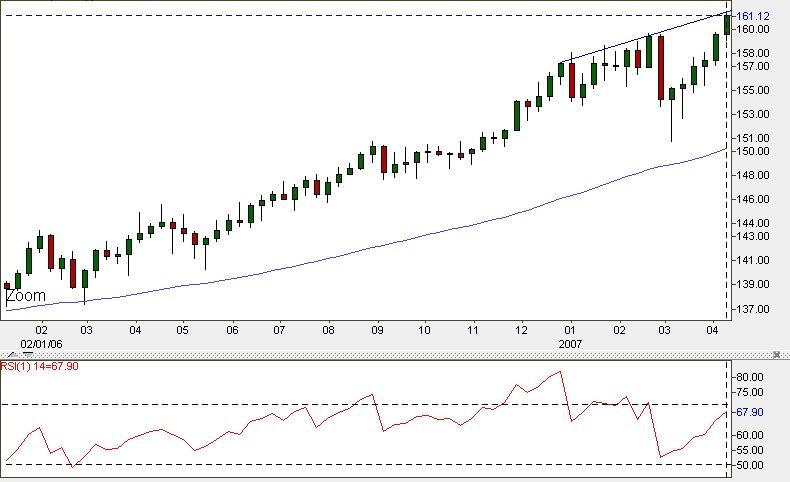
i was playing around with my dads old charting setup and i seen some of the yens are gonna have a pull back. he took at look at what i was lookin at and he said that i might be right. the wavey blue line in the middle is a MAE. the inecatior at the bottom is RSI. im shure you know the blue line on top is a trend line.
EUR/JPY Day
the price is higher and the RSI looks weak to me.
EUR/JPY Mo
my dad says it is ready to pull back but we can never really know which way it will go. i think the yens are gonna pull back within the next 2 or 3 days.
My son was looking at the day chart. I asked why he was looking at a chart. He said “look”. I ask for the week chart and told him how clear the picture of the break out is. I let him know 90% of all breakouts fail, and how I used to bank on this. He asked if I thought it would fail. I told him that if it doesn’t fail It will have some type of pull back before it continues. To try and express his reaction “WOW :eek:” When he is trading live, he is not allowed to take any other opportunities except what the trade rules allow. His interest are a little different than mine so he may develop his own trade style. That would be nice too.
I like that he has a good working knowledge of forex market at the young age of 14.
There is a clearly uptrend in EUR/JPY on daily an weekly chartc since jun 2005. In the daily chart it look like to be a retracement (but logicaly an uptrend reasume its the other possibility)… but what�s up ???.. I think we cant predict the market… my only interest is if I can trade at this particular moment… and my own answer is NOT. Why?. because the uptrend is extended from normality (sma 60), so I will wait for a possible retracement for open a trade, and if the retracement doesnt happen, for me its no time to open a trade yet…
Only a opinion of a newby in forex who desire to learn more.
Just for fun. I have no clue which way this thing is going Sunday, next week, or next month.
Place no trades based on what I am about to say. You will most likely lose your money.
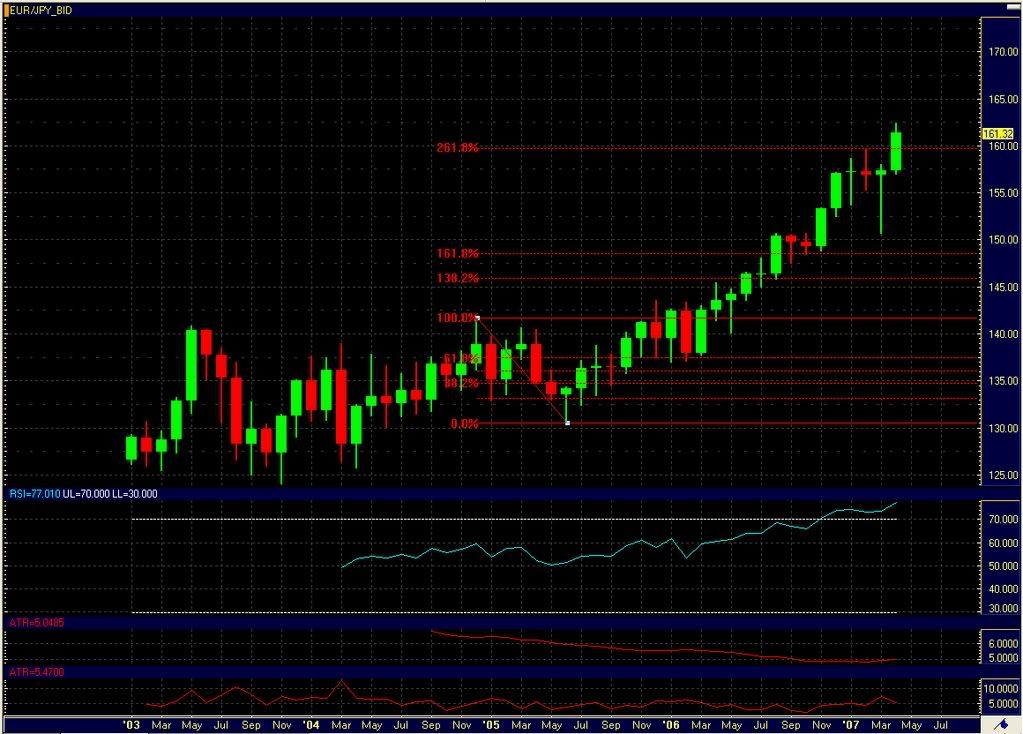
This would appear to me that the 261.8% line has been breached. There is a rule " 90% of all breakouts/throughs fail".
(261.8% resistance/support level) Seeing that the RSI is over sold at 77. I believe a pull back to below the 261.8% line would be in order.
Creating a channel between the 161.8% line and the 162.8% line.
Just for fun. I have no clue which way this thing is going Sunday, next week, or next month.
Place no trades based on what I am about to say. You will most likely lose your money.
Do you here an echo?
Maybe it is just ME me me…
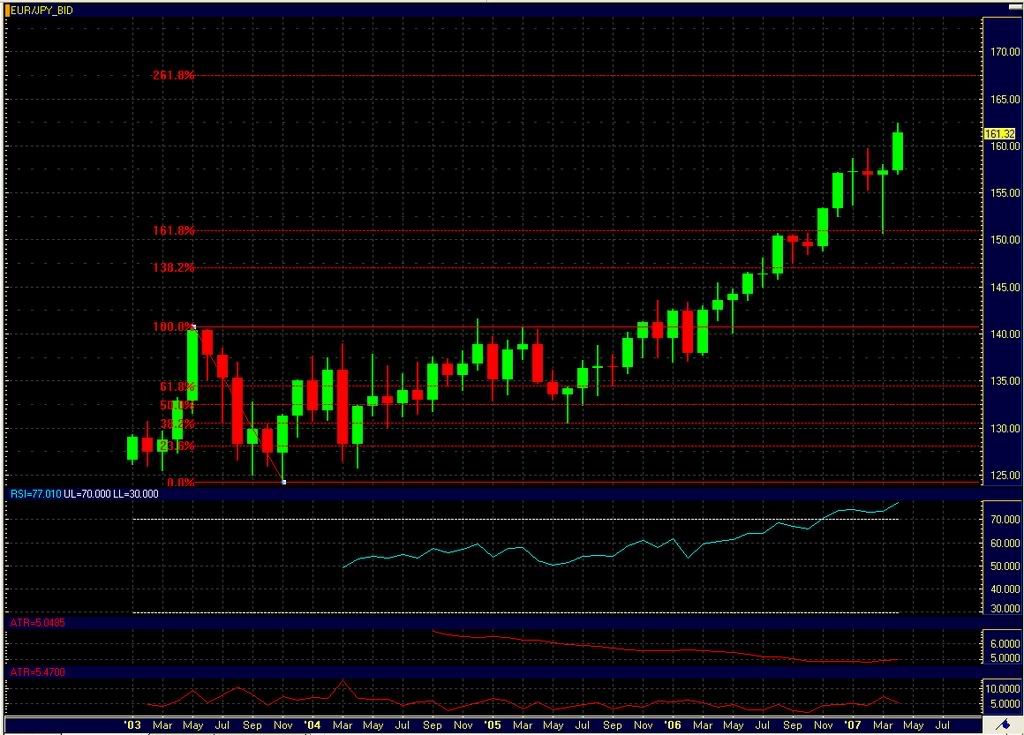
Same chart, different Fibb pull.
Now isn’t this something. The price reaches the 161.8 line and struggles and breaks it. A pull back happens. The price continues.
Next Fibb level about two candles away. The strength of the RSI may just get it there. A channel most likely will happen between
the 161.8% line and the 261.8 line.
In conclusion:
In the past. (many hours blood shot eye balling charts) I have learned that the closest history is the most reliable, and then the next, and so on.
That being said, the first most likely will happen and then the second just as I have stated it.
What do I really think is going to happen? I have no clue.
Love to all� have a great weekend.

 , im goin to my room!