hey dave, right compounding is the key ! those classic harmonic trading styles and simple S/r seems sufficent to achieve those goals. I had long time to realize this.
Thanks for the info. I tend to do something very similar to you as well, but only in demo for now as I am still fine tuning the way I do it to make a pretty consistent profit, I’m glad you have seen success in it. I agree with you that it is great that others like TMB are out there grabbing a small amount of pips each day for a simple gain that adds up very quickly in the end. I LOVE IT. I found when I first started trading that I would try and learn too many forms and was constantly switching my style and it really hurt me. Then I came upon this form and only use gartley’s in the majority of all my trades. keep up the good work!
FXtraitor,
It’s great you found something that works for you. I would suggest you try actually trading it with a small account as soon as possible.
One trap demo accounts can create is analysis paralysis. Nothing beats real trading to test the metal of your system (or maybe it’s your metal to stick to the system).
In any event, try realtime, real money trading. $500 is enough at 50:1 to see if it really works and you have the emotional confidence to trade it (assuming your broker takes micro accounts). As you build the $500 to $1,000 your confidence will grow along with your increasing position sizes; so by the time you’re trading at income producing levels, you have grown in maturity and confidence with your system.
Best of luck…

Good on you Duchas, I was thinking the same thing.
I’m still around and will definately post patterns that I think are worthwhile.
tmoneybags, please join us again
hi, I don’t understand this one. Isn’t the D point supposed to be determined by the convergence of the original XA fibs with the AB fibs as moved onto the point C? Here your D doesn’t seem to be on any of the fib points.
oops. I got it now. Your D point was 0.92912 originally, right? 
That’s right, but I accidently drew D to the to the high rather than the convergence point. Careless mistake, sorry for the confusion.
umm… modo what were you entry point, stop loss and Take profit in this trade?
Dear people,
Thanks everyone for the great info in this thread, obviously TMoneyBags the most.
I keep hearing of additional information such as “the major fib of AUS/USD is .500” or “.382 of XA converging with 1.27 of CD is good” ETC.
Is there somewhere I could get all of this info from? Which ratios are “excellent” for convergence?
Plus, what is the quickest way to determine if there is a Gartley or Butterfly pattern somewhere?
- Fib X to A
- Fib A to B
- Move the AB fib on top of the C point
- If there is a convergence of the XA fibs with the C fibs, that point is possibly a D point.
Obviously this is nowhere near what is needed to enter a trade, but can we say that if those are true, there is definitely a pattern? Considering all the other common criteria are met, of course, like the extremities of A, B, C etc.
I didn’t know about or take this trade. Was just posting the pattern as I saw it in response to Willworkforpips enquiry.
I found this thread a few months back and was really impressed. Ive been forex trading for about 8 montsh now and have a decent strategy. But its not exactly what I’m looking for. Im looking for something that has a more precise entry set up and this strategy seems like it can fulfill that.
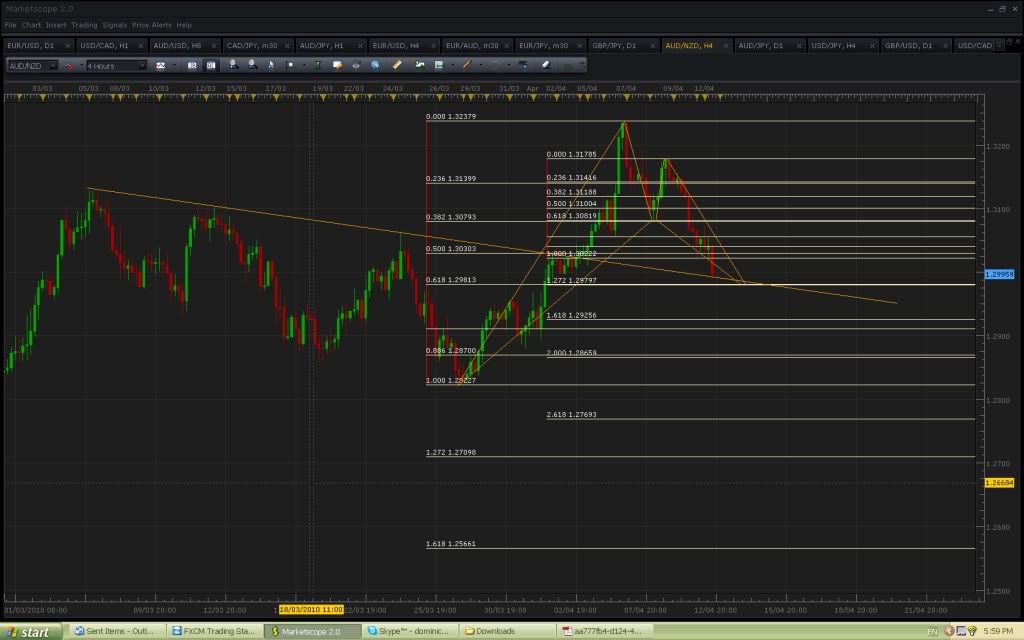
I have a few charts where i think i see patterns forming, Ill attach them, Feel free to critique them as you wish. If i am doing something wrong or you see i am missing something, Please let me know.
TMONEYBAGS - how did you save the Fib levels … for some reason whenever i click the Fib tool the defualt values come up only (.382 .500 and .618). Do you know how i can save the other values so that everytime i open up the Fib tool the correct values that i need for this system are already pre selected. Also i do not have the .786 .886 and the 1.272 values as standard … i have to add these values in manually and then they dont save once i have used the fib tool once. Any help … im using FXCM trading station with Marketscope 2.0 … but it looks a little different to the version you have ?
Thanks
Dan

EDIT: does anyone know how i can make the chart i just posted larger ?
You have to set the fib levels and click them to activate. After you have done that, you then have to click Set to Default to save the fib levels.
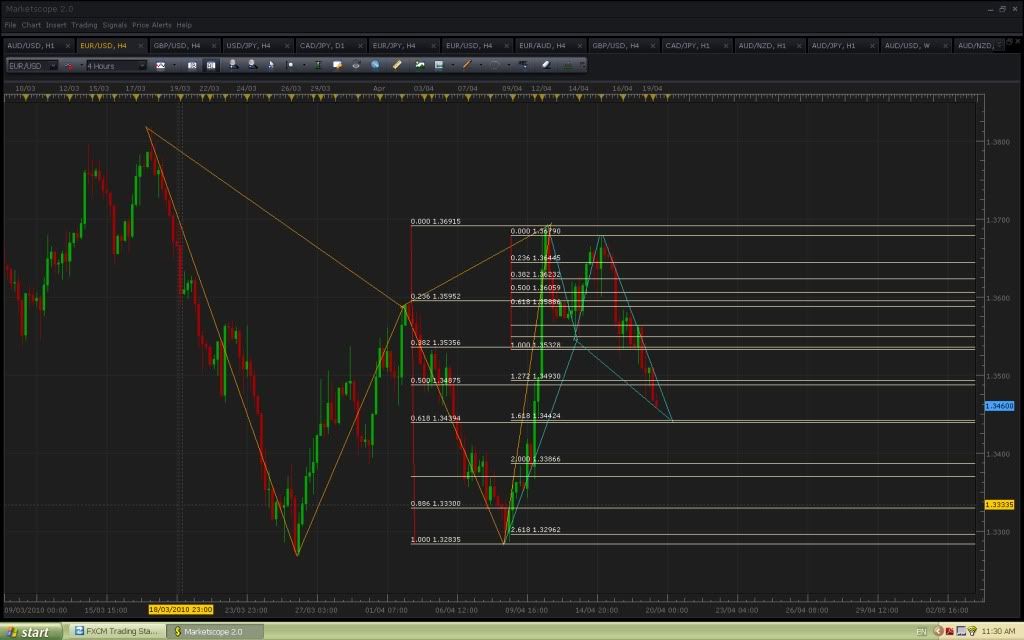
Possible bullish pattern on the euro, but within larger bearish pattern and broad downtrend, so not sure what to make of it. I can’t see much in terms of trendline support. Not too keen on it really, which can often be a good sign lol.
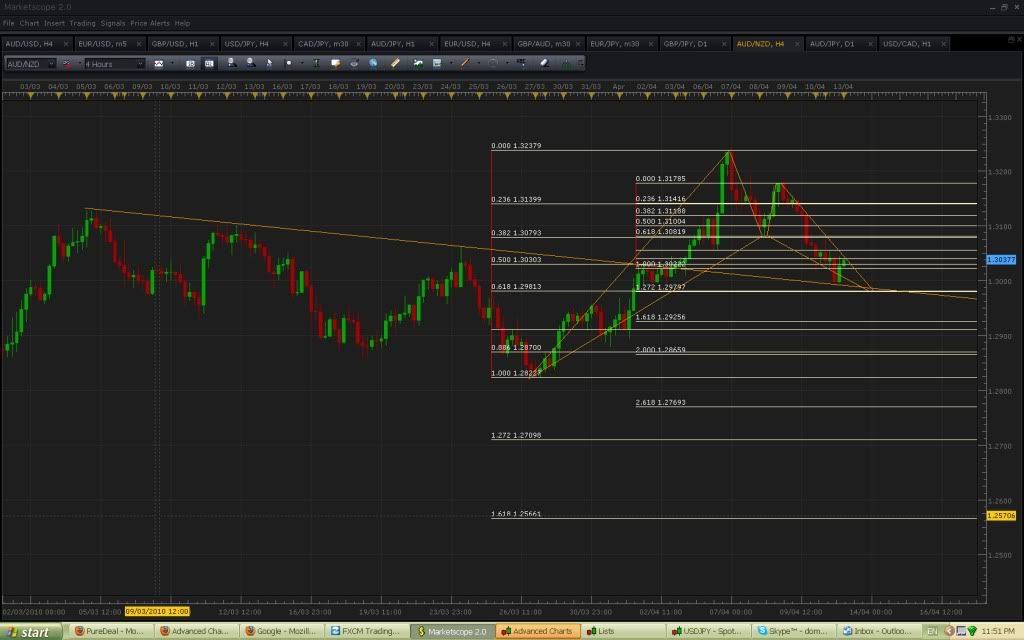
I have that same one drawn in my previous post. But i have my X comming from the Left low verses the Right low. This difference puts my D at 1.3430. I did this because Tmoney said to take X from the extreme point. Maybe I’m misunderstanding this.
I dont get convergece using your X (12 pip divergence), and I feel the X i am using is an extreme (swing) low and relates to the correction in question. But I could be wrong. Either way we have a similar area.
Do you use 3 sets of fibs. Bit hard to make out your chart.