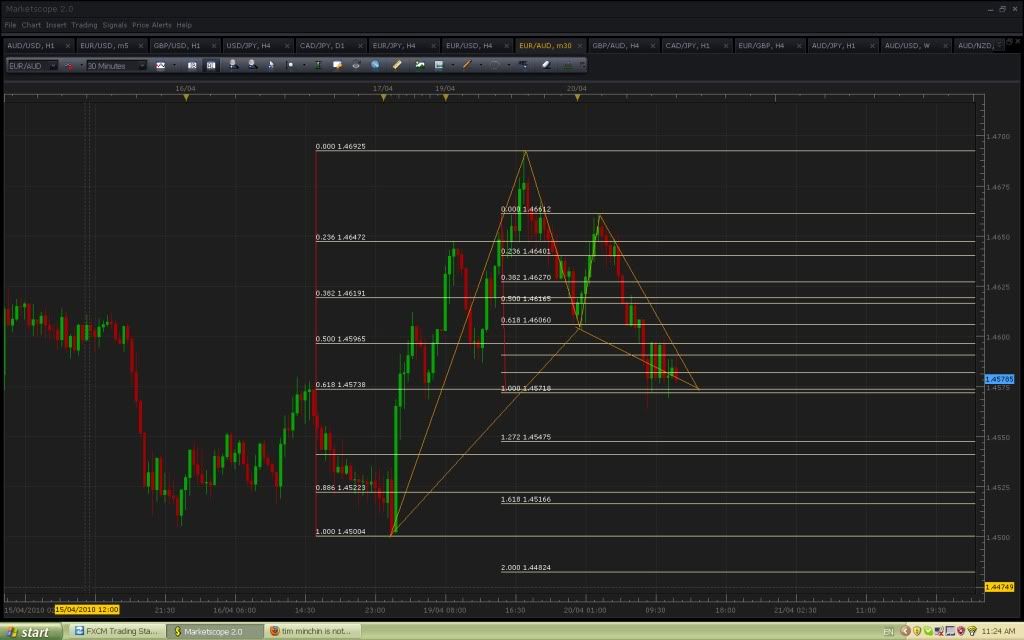
I am a newbie at this and dont quite understand what i am doing. So i would take your advice over mine. But, yes i use three sets of fibs.
here is a larger chart for you to see

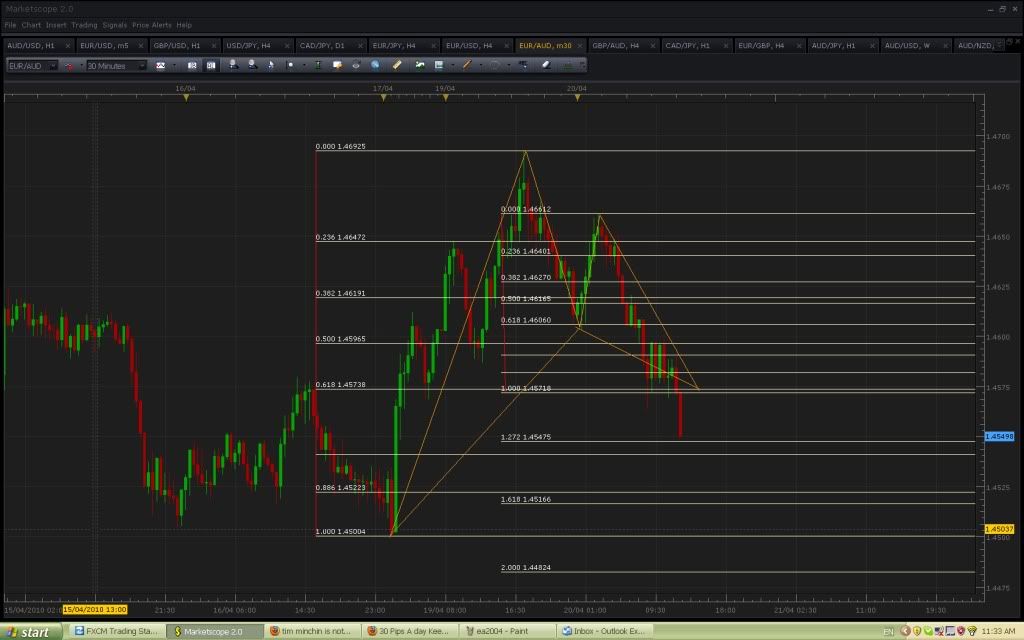
I am a newbie at this and dont quite understand what i am doing. So i would take your advice over mine. But, yes i use three sets of fibs.
here is a larger chart for you to see
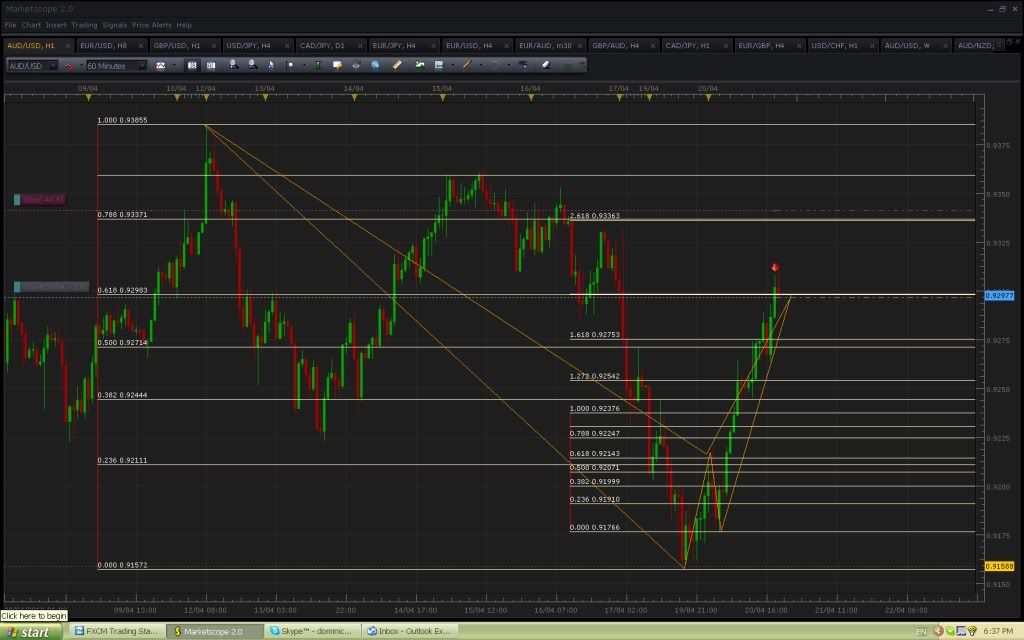
[B]USD/CHF 1Hr[/B]

Here is another one i am looking at.
[QUOTE=iMinDTriP;187026]I am a newbie at this and dont quite understand what i am doing. So i would take your advice over mine. But, yes i use three sets of fibs.
here is a larger chart for you to see
first of all, newbie or not, it looks like you are on top of it so good on you (although i still don’t quite get the 3rd fibs), and don’t pay too much attention to me cos i get it wrong all the time.
as for our difference, is it possible you are working from the bid. i use the ask for long patterns and bid for short.
you are right that the X should be an extreme in price, but in my experience it does not have to be the absolute high/low (otherwise there would only be 2 possible X’s on any chart). in this case i thought my X was ok becuase of the impulsive nature of the XA move (possible flag pole), so i thought the termination of the correction would relate to that move. i guess choices for x can become a little subjective, which is why it’s always good to have an additional form of confirmation like a trendline, support/res, pivot or convergence from another X.
initial price reation at D was good but missed my bid. i don’t think i’ll buy a retest due to time of day.
all the best.
modo
I totally forgot about the bid/ask thing, that could be the problem.
As far as the three fibs. The first one is XA, second is AB and third is BA moved to C. I just didnt delete the AB fib.
oh cool, that makes sense
Hi guys, need to ask something.
When determining the points, does A have to be the highest (or lowest for bearish) point between X and A?
Hi friends, here’s what looked like a good Butterfly pattern on USD/CAD 2H, but failed:

Was this a wrong pattern and is that why it failed? Or did it fail because of some news? Or did it just fail?
Thanks for any feedback.
b should be 61.8 or 78.6 of xa, othen than that this strong bullish candle right before your convergence should set you in alert mode.
I am seeing a pattern in GBP/JPY 15min. Although, the B-C retracement was at .382 so that should mean it would be a butterfly pattern. Here it looks just between a butterfly and a Gartley 222. Comments would be much appreciated.

Is that a hard rule? Because I have seen many charts here with B’s all the way up to 1.00 of XA.
I agree. But one thing which is more important is that it is fine that you set a goal to target daily but you should also keep in mind that how much you can lose.
Tmoneybags
Im glad to see that your a young trader like myself. Support!!!
I also see that you have a link for mark douglas’s book - I just finished reading his book “Trading the Zone”
Keep up the good work with 30 pips a day - we will be living on the same island.
I want to correct myself on this one. TMoneyBags has repeatedly said that a D needs to be at least at %100 of CD fibs. Mine is at the 786 level, so this is not a valid pattern.
I am very sorry that the guy himself has left this thread  Kudos do modo and others trying to keep it alive, though.
hi guys,
i’m watching this today. not the highest percentage play as price is finding resistance on falling daily trendline, but a couple of wicks suggesting possible change in control. rba minutes out in 5 could bring some volatility, potentially slightly more dovish tone given comments last week from dept governor.
just something to watch.
here is wot am looking at
thanks mate, very nice.
i’m watching this, not the prettiest but could be putting in a reversal candle.
hmm, i just noticed the additional convergence above at .9336.
maybe this is not a good idea.
Can anyone clarify the rules for a gartly pattern as i am a little confused. Does the BC leg have to have a retracement somewhere between 0.500% and 1.000% for a bearish pattern ? Also does the D point have to have a convergence of 1.000% CD with the 0.500% of XA ?
Ive notived that TMB has convergence with different percentages other then the he mentions in his videos. ?
I wouldn’t trade the Ausi for a few days. I’ve analyzed the pair this morning and every single pattern on the higher time frame (even though they have worked out in the end) have been complete fake outs of over 50 pips. In addition, I would like every one to consider the Kiwi as an alternative since it has been respecting the majority of its fib levels.
*Caution (Please note that their will be significant ausi news coming out within the week)