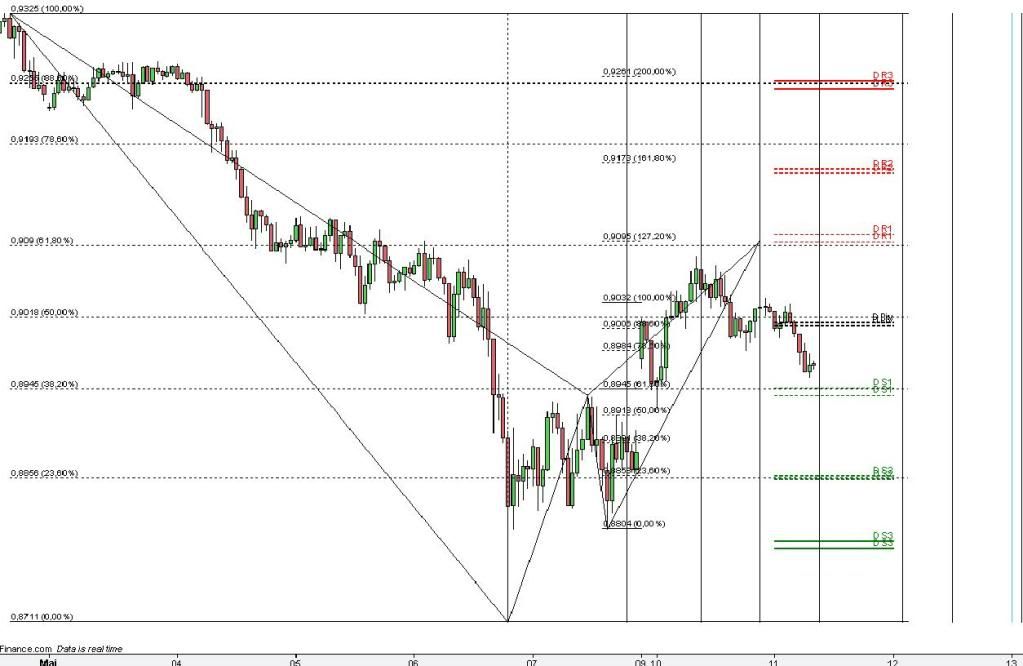
The price didnt reach the D, but as i said yesterday there where lots of Selling Gartleys in the market, and the AUD/USD moved abit slower then the rest of the pairs. So i made the decision to take the trade with only 1,5% risk of my capital insead fo the normal 3%. Took it at 0,90271 and got out with 30 pips at 0,89971. Anyway here is the pattern.
I am devastated that my bank couldnt get their act together to help me fund my account in time,
so i demoed - Shorted at 1.3055, and just 4,000 Oanda units - and got out when my $900 demo account hit $1000.
i was going to put $200 on it with my real account but i am still sorting out the funding. kind of annoying.
but i wouldnt have used ‘pattern trading’ yesterday, although the D would have formed around the 1.29, i had a fundamental s+r idea that 1.30 would be broken and then come down - and i guess im just happy about being right
so much fundamental analysis behind this pair though, ive done economics and am currently doing finance at university, and the idea of one currency for countries with totally differing monetary policy needs is just unsustainable.
there is also some mumbling of a break-up - but that is a bit extreme.
would love to be holding the 4,000 units still though, i just calculated that it would have been about a 20% increase in my account - and i had only risked [stop loss] at about 10 pips and it didnt get hit, so that was nice.
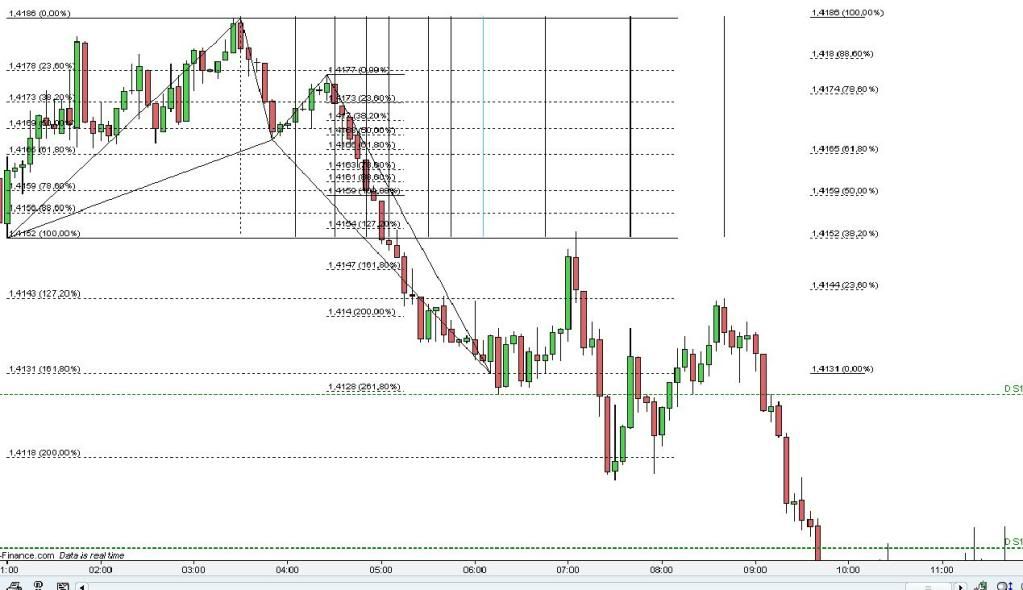
Could anyone advised me what wrong with the butterfly pattern that i have draw??I enter at 1.4143 (yellow circle)…the pattern was failed afterward…could some one please advise me what i have done wrongly???
Nice analysis Sad it wasent reall money but anyway I am my self only doing demo, have been for some months. For me atm it is most about learning to do the right things and the satasfication about beaing right and when i am wrong learn why. I am right in the middle of selling of my apartment and buying a other one so ill wait with my real money. And im also going to start studying at the University so i fell i have then more time on doing proper analysis
Look at TMB’s great movies to see how you draw the patterns.
First of i dont myself trade the 5m charts. Mabey to look on the candles how they are forming or a re entry to a bigger pattern. I try to use as TMB have adviced 1hr or 30 mins, sometimes 15 mins.
There is some convergence at around 1,4159. But if you look on how the CD leg is forming, only very bullish candles i would try and find a D around fib lvl 200 or 261,8 of AB. I my self also trys to find fib convergence at pivot points so in this case i would have put my D around 1,4130.
The main reason i dont trade patterns on lower timeframes is becouse my first target in the trade is at 0,236% of DA and that should be 30 or more pips from the D becouse as TMB have advices i only go for 30 pips.
So to put it short. The candles in the CD legs is a warning that the price wont respect a convergence at 100% of AB try and look futher down.
I dont trade to low timeframes mainly becouse i go for 30 pips and a reatracement on a 5 min chart is often to small movments.
guys, i have read that gartley apparently claims 75% success rate ON ITS OWN. This I’m afraid is nonsense. If gartleys were that good on their own, everyone would trade them.
Reading Gartleys and Butterflies alone won’t do the trick. You always have to make an analysis of the market: Both on a higher time scale, and do your fundamental homework (check on the news).
You can’t just expect to find ten Gartleys every day and make 500 pips. After a while finding those patterns becomes second nature and you can find them easily. But not all of them can make money for you. You have to analyze the market.
That being said, TMB, we are still waiting for your updated method…
As a noob, I feel analyzing the market is something i really need to learn about. Currently im trading abcd patterns, so it kind of relates to the gartley butterfly methods being implemented in this thread. When you say look at the market from a higher time scale, what is it you look for in that chart?
Of course, the price seems to be rising now, but doesn’t matter as it shot right through the convergence and dived below 20pips. I would have set my stop loss at 15-20pips, and would have never seen the rise in price.
However, as you can see, when the price initially fell to the convergence levels, it did indeed make a 40 pip upwards push. The thing is, before making this push, it never reached the convergence, and it missed it by 5 pips.
TMB please could you post the last 3-4 EUR/JPY trades that you have done … im getting so frustrated with myself for not being able to draw these patterns right !
when we look for a pattern are we always looking for an XABC to already have occured ? … then we find out from that where D is ?
Or can we draw a pattern that only has XAB and wait for C to develop then draw D from that ? … im so confused
Annihilator – what was you reason for drawing the C point at that particular swing high … why not the swing high just before the one that you choose … this is one of the things that im getting frustrated with - which points to use for ABC. If you were watching that chart at that time and you saw all those points develop the C point would of been at the swing high before the one you drew, right ? Any help
The thing you’re missing is the fact that between two points, those two points have to be the extremes. For example, I couldn’t have chosen the previous swing like you said, because then it wouldn’t be the highest point between C and D. You must choose all points so that:
ahhh i see now lol … thanks for clrearing that up for me, now i understand what is was doing wrong.
so i would be impossible/difficult to draw XAB and then wait for C to develop becuase the current B point might not be the extreme … in other words, whever we draw a pattern we are looking for XABC to have already developed – is this correct ?
Yes. Another rule is that in terms of extremity, C must be between A and B. So if you wait only for XAB, the C might prove to be invalid. XABC must have formed, and the price must be heading for D when you construct your patterns.
Thanks for the help again … just wondering if you yourself are trading this ‘system’ and how succesfull its been for you. It seems as though most people are not as successful at this as TMB