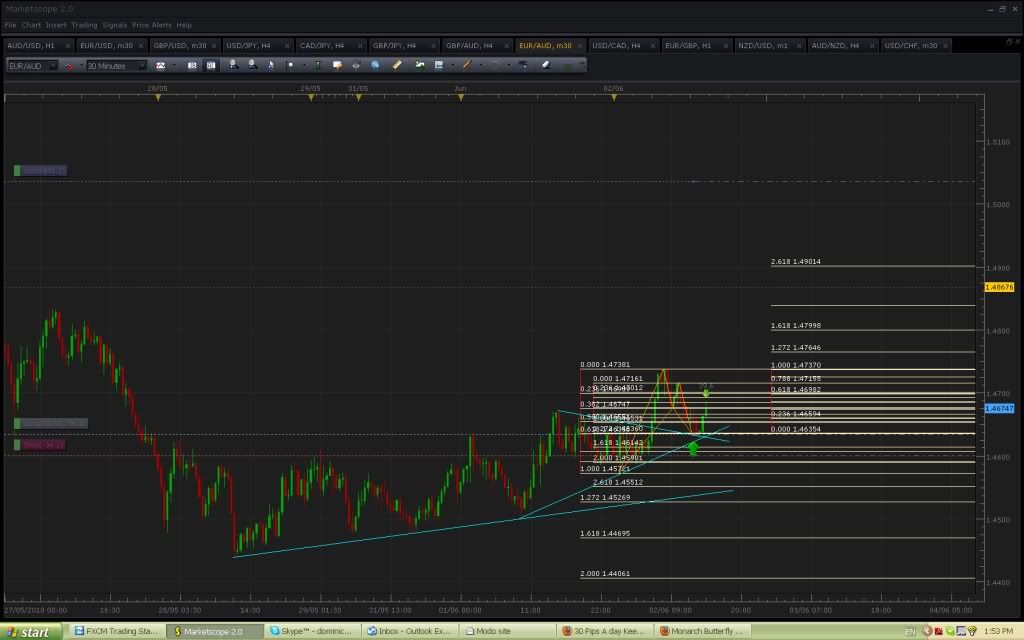
Just to add to this Friday trading dispute, I managed 60 pips on the euro/usd with a clean looking gartley. ((30/60 min time frames) Also made nearly 30% on my account this week, but been taking more than 30 pips on each trade)
Excellent increase on your account!
Can you do me a big favour and post your euro/usd chart?
Do you trade with and against the trend, or only with the trend?
Here we go, Its actually a butterfly not a gartley, my bad.

I usually trade with the trend but if the trend is against me and there are other timeframes with confirming patterns then I will usually trade against the trend. Afterall, you only need to take 30 pips right?
On this occasion it seems I was trading with the downtrend although we might be close to the bottom of this trend now, im not too sure on the fundamentals.
Anyway, there was a repeating 4 hour pattern also confirming my 30 minute pattern so i took it. Hope this helps
Thanks for your your post naughtypip. Very helpful.
Unfortunaltely I noticed this too late, but it seems to have textbook gartley dimensions.
Will look for a short term pattern for entry.
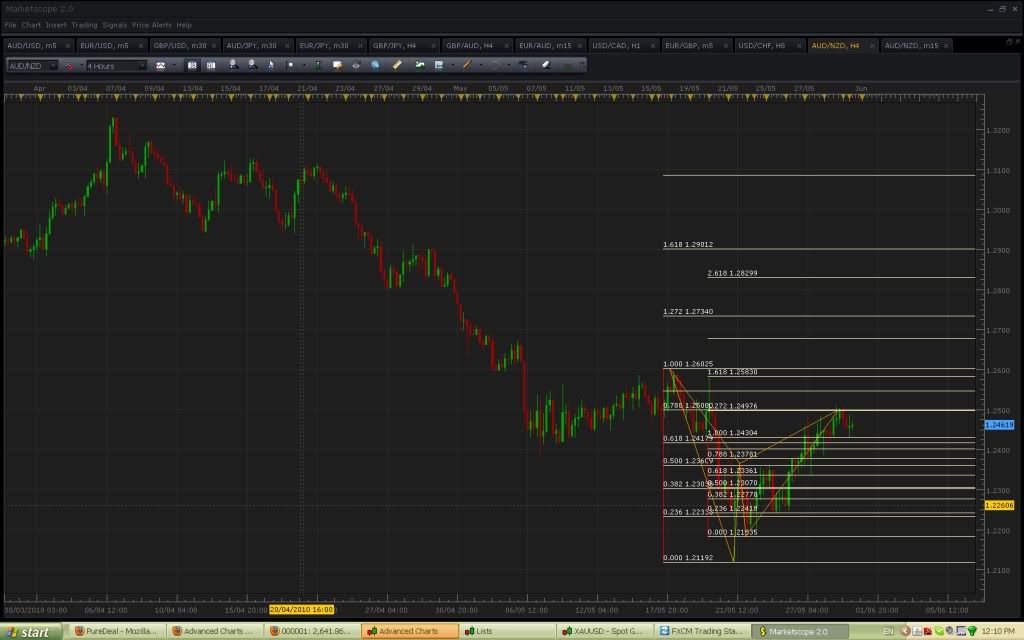
Although B retracement is only 50%, and maybe the CD leg has taken too long…
I don’t know, you decide.
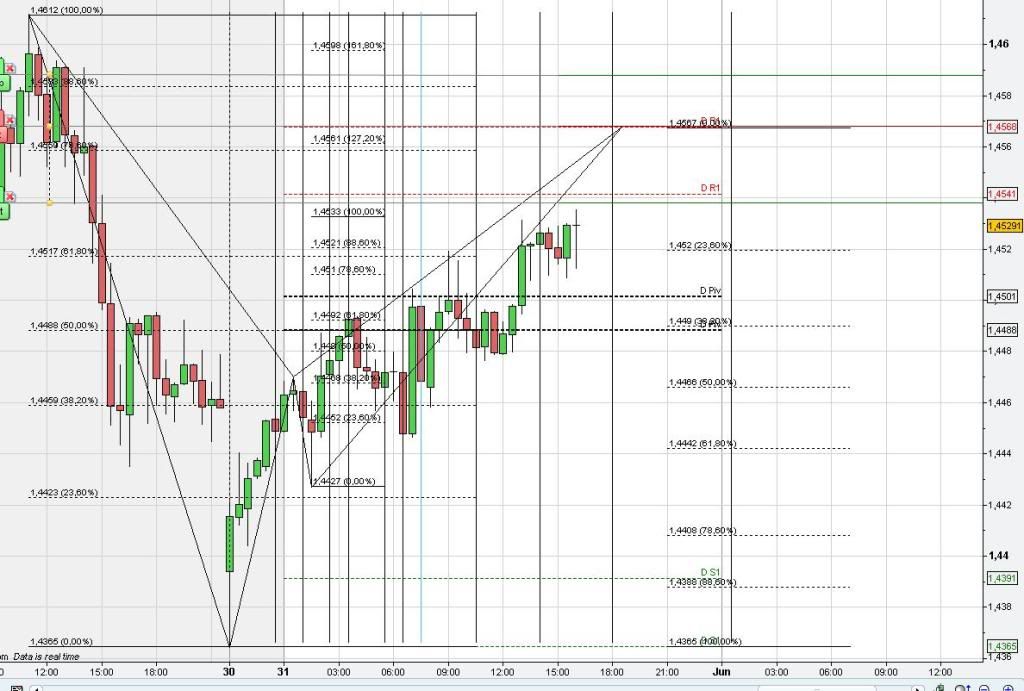
Hello all, here is two possible Gartleys.
First of is a pattern on the GBP/USD 30 min, convergece at a pivot.
And here is my favorite of the two Gartley on USD/JPY 4hrs. As you can see the price retraced on the previos fib convergence, and my D is also converged with a pivot. do as you like.
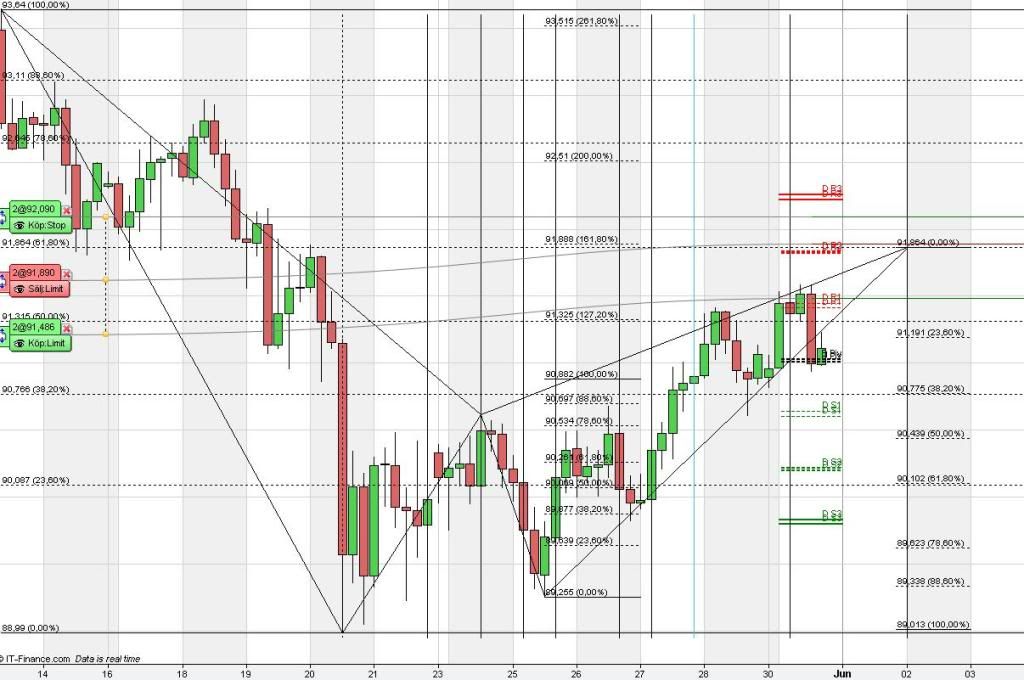
Its a sunny day in Sweden today! 
//Chris
on what does it depend at which level you draw the end of the right wing? i didnt get which fib levels you look at…
your looking for the fib levels that converge the most.
thanks NP, so its all about convergence? no other information i have to consider?
Yea there are quite a few rules, all in this thread. Search rules of the trade, theres a list somewhere in this thread.

Blew right through that convergence. Now heading for the 1.272/1.618 convergence (4 pips), unless it runs out of steam.

Great stuff, congratulations Highlander.
I’m quite pleased with this as there were reasons other than the pattern to take the trade.
D was on rising (and steepening) trendline support, and was also testing upper bounds of broken downtrend line (or possible trinagle).
I took 2/5th pos off at the .382AD and will allow the rest to run risk free.
Good chance it will run out of puff, but I have given it every chance.
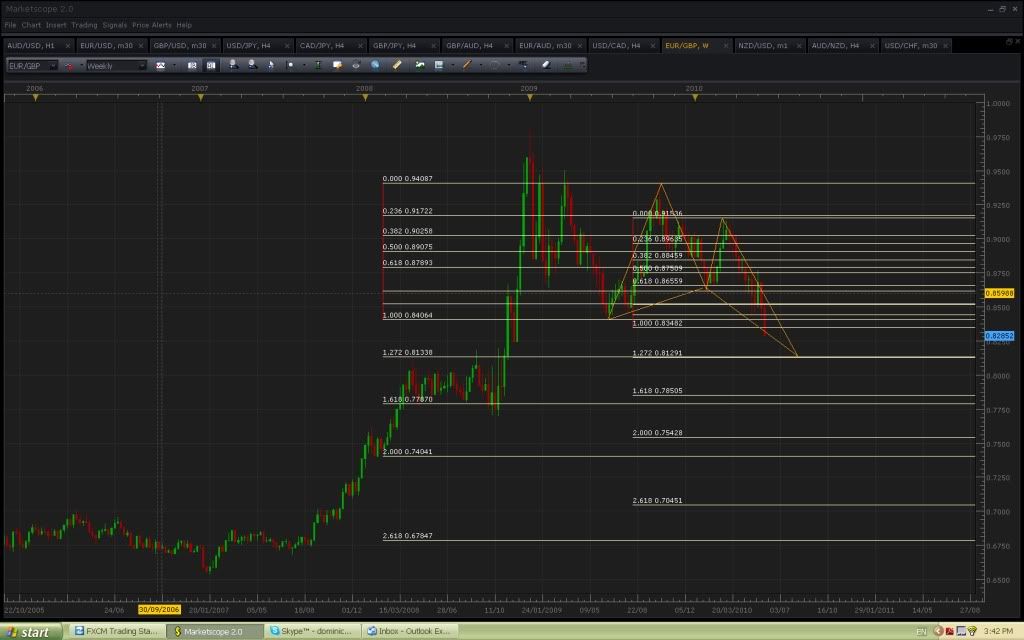
Also keeping a close eye on this. Appears to have good butterfly proportions with the .786 B retracement. D resting at lower end of broad price channel, could even argue it’s a bull flag. D also at area of previous resistance.
Wont take the weekly pattern outright, but will definately be zooming down the timeframe to look for cheap entries (from short term patterns) with big profit targets (from weekly pattern)
All the best.
Modo when you analyse these charts do you look at higher timeframes aswell ie top down analysis?? Or do just tend to work with the timeframe you are opening a trade in?
Hi Naughtypip
I start with the highest timeframe and work my way in. The analogy I like is that of an impressionist painting, where if you are 2 feet away it’s just meaningless brushstrokes (noise), but from further back it’s a masterpiece. It’s critical to see the picture (ie the longer timeframe) before you zoom in closer…that way you will have some context to the shorter patterns. Just say you are in the market for a car, well that’s the weekly pattern, then you must decide what make of car, what colour, how many seats etc etc, always narrowing it down (akin to moving down the timeframes), the bam, you pull the trigger.
I also find knowing the daily or weekly structures will give you the confidence to hold shorter trades through pullbacks. If you are ever wavering in a trade and tempted to take profit too early, I find it helpful to move out in timeframe to seek assurance and get away from the noise.
Once I have found a pattern on a daily, weekly, or 4 hour basis, then I will move down in timeframe to try to find an entry on say the hourly, 5 min, or even 1 min charts. In my limited experience I have found there is no rush to get involved in these patterns, they may take a couple of days or even weeks to play out, with a couple of false moves for good measure.
As I use the next XA fib as my stop, trading directly off the 4hr or above would require a very large stops in terms of pips, and as i trade max 0.5%/trade, this means i could only put on a very small postion. So if I can find entry on say a 1 minute chart into a daily pattern, I can use a very tight stop (hence big position), yet use the profit target from the daily pattern. In this way you can get big multilples on your risk.
The challenge is waiting patiently for these opportunities. When they show up you invariably know them, but in waiting you can overtrade and take less than ideal trades (like me over the last 3 weeks). Remember, no position is a position, and I think patience is often underestimated as a trait of a good trader.
Anyway, these are just my theories, working through it all myself and trying to develop my own style. By no means claiming to have all (or any) answers, just sharing my thoughts.
Thanks modo, that clears alot of things up, a lot of people on this thread (myself included), never seem to mention whats going on in the higher timeframes (myself included), so we are only seeing a fraction of the picture, maybe more analysis explanation will benefit us all.