Another fail, this time from NZD/USD 30M, nearly perfect convergence, yet the price did not care the slightest.

Another fail, this time from NZD/USD 30M, nearly perfect convergence, yet the price did not care the slightest.
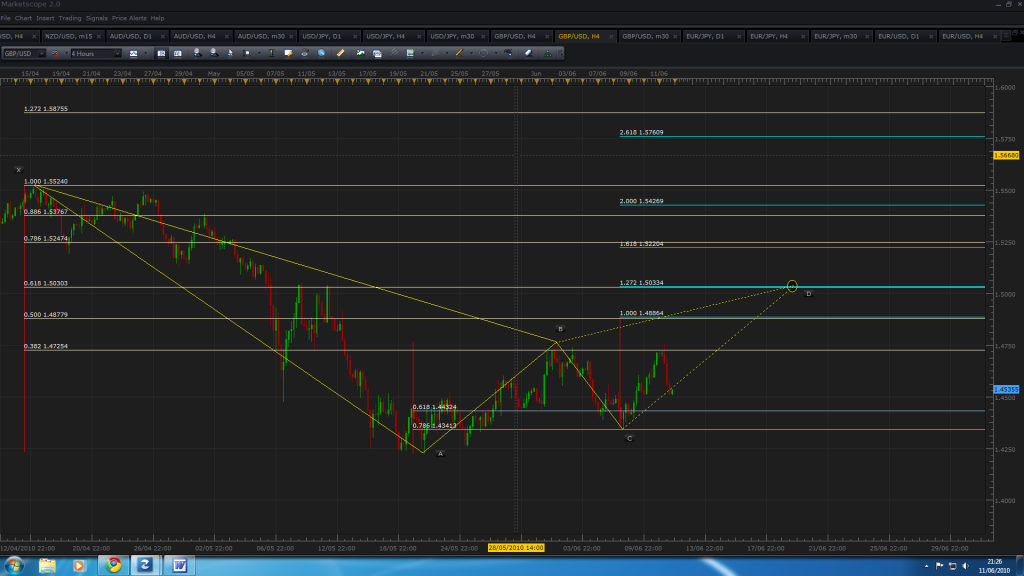
x: 3 june 8.00
a: 7 june 0.00
b: 7 june 16.00
c: 8 june 12.00
d: today 12.00
Annihilator, maybe try this setup ive drawn the pattern differently. Its reaching max gartley so if it doesnt bounce here then its just gonna keep on going.
Also there is a smaller pattern confirming this :
Hope this is useful. Not too sure whether 2.618 is allowed on the cd, gonna go check now.
EDIT - Just realised that the above pattern is wrong,
although the first one seems ok…
****RE EDIT - Sorry its right LOL, its just the purple lines that are wrong (drew the purple lines on last in a rush), but the fibs are right
Naughtypip: Yeah, but as you can see the pattern I drew had much better convergence…
And if you look closely you can see that even in the pattern you drew, there is convergence at my point, which should have solidified it, yet the price rocketed right through it.
I don’t like it when this happens, lol. I didn’t put any money for this, but it annoys me that something that “should have” worked simply didn’t.
A pattern RIGHT NOW!
GBP/JPY 30M
x: 136.41
a: 130.41
b: 132.50
c: 131.40
d: 134.05
Well i tend to go for symmetry when drawing these patterns, but i see what you mean about the convergence, we will just have to wait and see I guess :eek:
If you draw a Bearish Butterfly for example but your point D isn’t hit in the timeframe that you would expect but then is hit maybe 8 hours or so later would it still be considered a valid short entry at that point?
I’m guessing that the answer is probably that it depends on the price action in between the predicted entry time and the delayed entry time and also the time that it hits the projected point of D (given what I read earlier in the thread that some times are more prone to Fake D’s).
I’m looking at such a one now with EUR/JPY with the following:
X: 110.591
A: 108.965
B: 110.035
C: 109.098
D1: ~111.02 (convergence of 1.272 XA and 1.786 CD)
D2: ~111.22 (convergence of 1.382 XA and 2.000 CD)
The above might not be correct. It’s only about the 3rd or 4th Butterfly I’ve tried to drawn but the question is still one that I’ve come across with each one I’ve tried to draw so far.
Any help / insight would be appreciated.
Firstly this would depend on the timeframe you are trading in, if its an hour or 4 hour then yes, anything timeframe less than that and you might be looking at a failed pattern.
Secondly, the convergence you are seeing is invalid since the fib levels you are using dont count. These are the only fib levels you should be using for this method:
0.0
.236
.382
.5
.618
.786
.886
1.0
1.272
1.618
2.0
2.618
Also you may already know this but incase you dont, the cd leg must always be at least 100 percent of ab.

I missed my 83 pip limit on this by 0.8 of a pip while I was sleeping. I blame myself for poor execution. Ended up scratching the trade.
The long euro did well though, although i chickened out an bailed a little early.
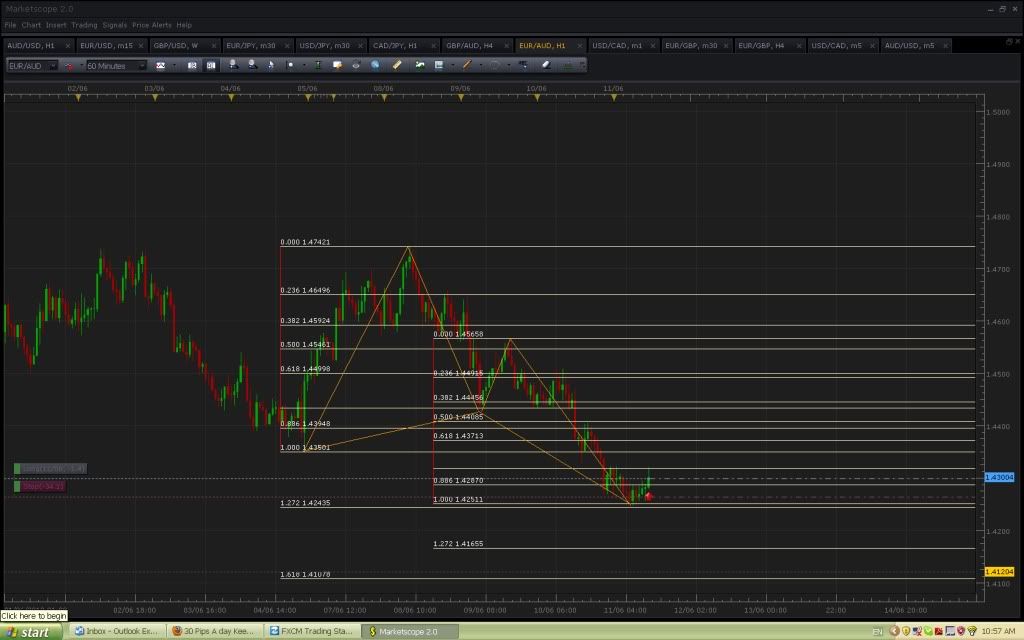
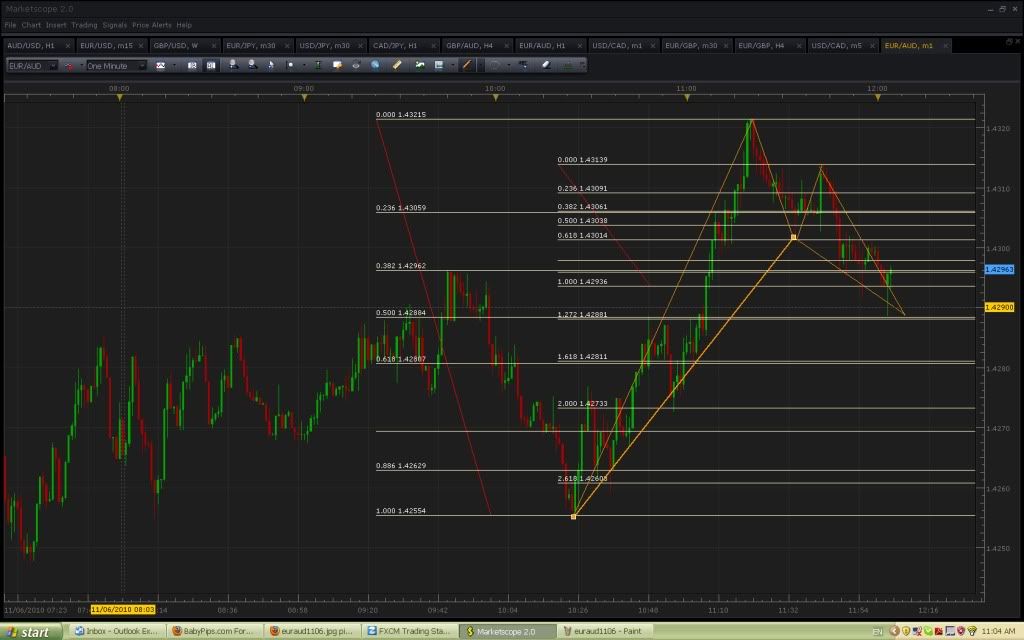
Not sure if i can use the second retracement like this for my A point, but the .786 is good for butterflies. The level was respected well, and also lines up with the .786 retracement of the advance from the lows on the daily chart.
As such, I have entered on the basis of this 1 minute chart, stop is at 1.4264 (but note there is an additional convergence below)
hi guys,
price bounced nicely from the second convergence, but was unable to make a new high on the hourly basis. i took 22 pips on half to partially cover my stop, but i don’t hold much hope for this trade, mainly because i think eurgbp will break lower to the .8125 level of the weekly butterfly.
anyway, i’ll let it ride, but just letting you know that it’s probably a dud. (although there is another 1 min D here at 1.4290)
another failed pattern… gosh, I am great at finding failing patterns…

It bounced  missed my entry point by one pip though
  with a bit of luck it might retest the area…
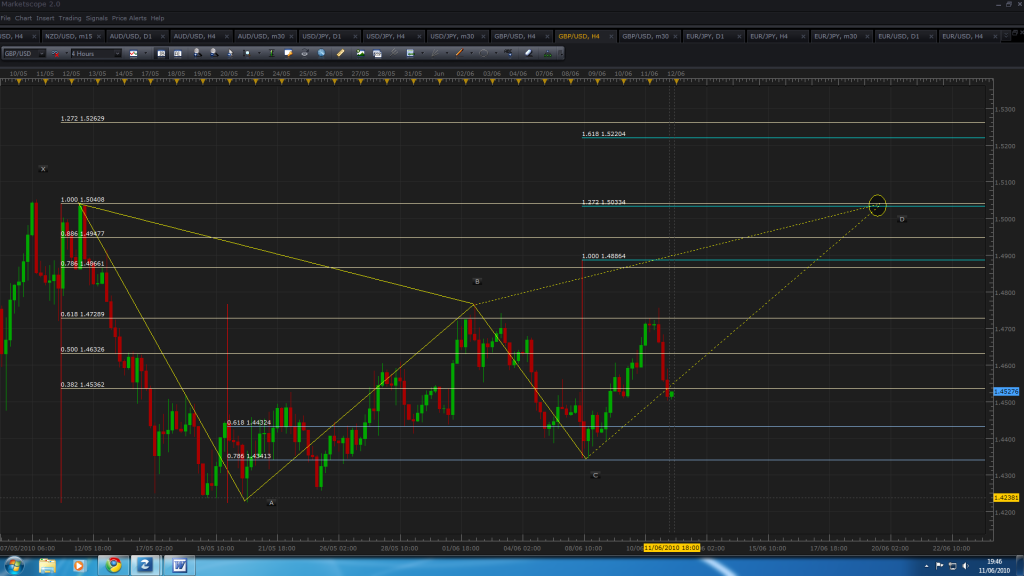
GBP/USD 4 Hour Chart
Could somebody please have a look over it and see if I drew a possible Bearish Gartley correctly? I’m trying to get the hang of drawing these correctly before I start to trade off them. Seems like a prudent course of action 
The symmetry looks ok but the convergence spread seems a shade wide at 7 pips maybe?
Also not too sure about it only reaching the 100% of XA. I saw it being done a few times earlier in the thread by TMB but I’m not sure he placed much validity in them. I think he called them rare Gartleys or something. I got the book he recommended so will be reading up this weekend.
Cheers in advance…
%100 XAs are possible and wouldn’t deter me from a certain pattern.
Your pattern looks correct, but your X is not a very extreme point. If you go back to only a few days before, there are much higher extremes. So I don’t think it’s a very valid pattern.
Ah yes I remember reading that now - look for the extreme X and not some leg in the middle.
I went ahead and followed your advice and it actually looks a lot better I think. The convergence drops to 3 pips and 1.272 of CD falls right on the 0.618 of XA which would make it a more regular Gartley.
Not sure if GBP has the legs to get back up to 1.50 in the next 10 days or so but I’ll keep an eye on it anyway.
Thanks for the advice.
Hey, yeah this looks to be a much better pattern now… although on exact calculations my results show a 9 pip convergence which is not very good. Yours shows 3 pips, but for example your X is at 1.55240, whereas the highest price at that time was 1.55226, and stuff like that.
I first draw by hand, and then when there seems to be some sort of possible convergence, I manually enter the numbers to make it “exact”. And with exact calculations, the convergence is 8.5 pips here. Still worth watching, though, if the price starts going up I might be looking into 30min or 15min patterns confirming the convergence.
How do you manually calculate the projected point D?
I get how to arrive at XA’s exact Fib number:
1.55226+(1.55226-1.42256)*0.618 = 1.50271.
Or I can use a Fib calculator to make life a little easier given that we have the beginning and end points 
Not sure how to arrive at an exact figure for CD however to get the 8.5 pip convergence you mentioned given that it’s an Fib extension of BA which has been lifted up to start at C. I tried doing:
1.43455+(1.47695-1.42256)*1.272 = 1.503734 but that’s a 10.2 pip convergence so I guess I’m doing something wrong.
Maybe I’m missing something really obvious after a brutal week in work… :rolleyes:
Edit to add:
Acutally I think I know what you meant. Is your method that you open up the Fib tool in your chart package and manually enter in the numbers for X & A using the high / low for the bars. This then gives the precise Fib level for XA.
Then you do the draw the AB Fib and once done use the same method of inputting the values into the Fib tool using the exact high / low for the bars to give precise levels.
Then you move this Fib up to begin at C and edit the tool again by inputting the exact value for C to give you the precise beginning point. You can leave the upper value alone as the height hasn’t changed one bit from the AB Fib and remains accurate once your C is accurate.
Final Edit:
Hmm, not sure the above would work actually. Once you move the BA Fib up to C and then fine tune the price at C to make it completely accurate the endpoint at 100.00 doesn’t change so you end up with a Fib that has a slightly different length to the BA one.
9 pips convergence is pretty good convergence I would say.
On a 30 to 60 mins chart, excellent convergence is classed as 0 - 2 pips. So logically wouldnt you times this by 4 to give you the excellent convergence for a 4 hour chart? Which would be 0 - 8 pips.
good one see that has been past resistance in the past sure i will play it if we get there.