I tend to think of convergences as relative to the range of price movements. Think of a regular chart, with normal zoom - and think of its vertical axis. What is the difference between two values - 25 pips, 50 pips, 100 pips or more? The more the difference is, the more the price movements are, and the larger your convergence “can” be.
In that particular chart the differences I think were 50 pips which makes a 9 pip convergence bad-mediocre. At least this has been my experience.
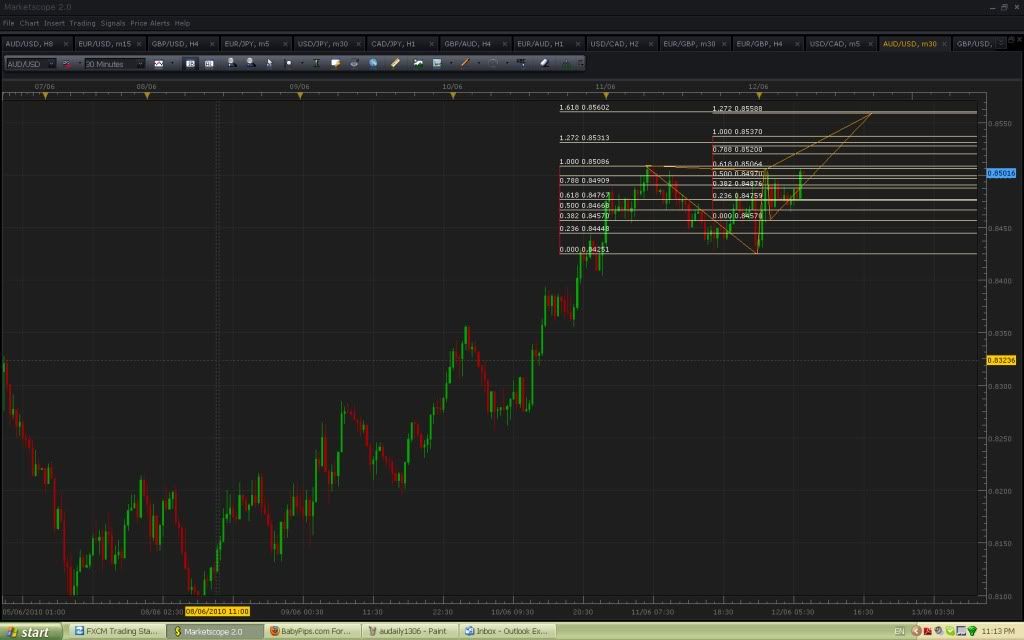
Yep I saw that one on the Aussie 30 min too though maybe it’s delayed too much by now given it’s a short timeframe? I’m going to keep my eye on it anyway to see how it plays out.
Recent ones I’ve been watching in the short term charts have been retracing 30+ pips despite hitting the levels later than anticipated in the pattern e.g. the recent EUR/USD bearish butterfly on the 30 min charts and the bearish Gartley on the NZD/USD 30 min charts.
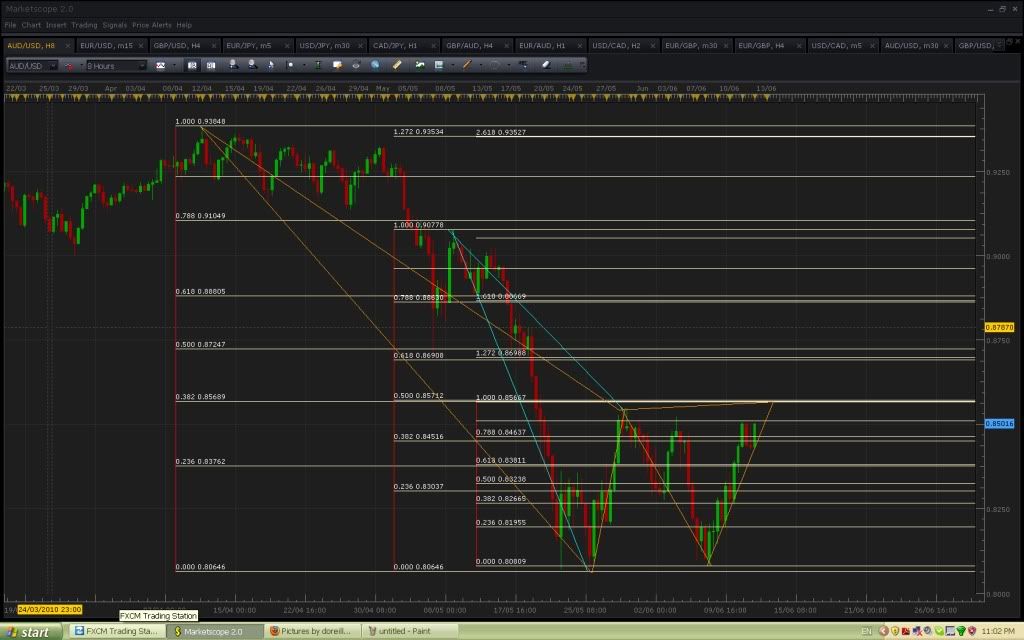
The first prediction was correct - the price reacted to the 30min convergence slightly (15 pip down move) but is now going up. If it indeed makes a solid rebound at the 8h convergence (~0.8560) I think we can all be amazed at the power of this method!
Yeah, i’m short at 60 but not liking it. Sentiment to risk has changed over the last couple of days, and it’s hard to see a catalyst to turn this quiet market around.
But I do want to be short aussie, so I guess it cant hurt to send a few troops out here.
I use the Forex Factory economic calendar for economic releases, but don’t have a good real time news source. I generally keep an eye on bloomberg, but try not to pay too much attention as I am trying trade what I see rather than what I think (which is usually wrong lol). To be honest I would probably do better with no news at all.
Yep, I see what you are saying about the news. Honestly I’m of the conclusion that the more parameters you allow into making your Forex decisions, the worse you do, unless you are incredibly experienced.
The trade fell through, yeah. Lost 19 pips here. The resistance at the convergence was noteworthy but not enough. Pity - it was a 8hr pattern with very good convergence, which means it should have worked.
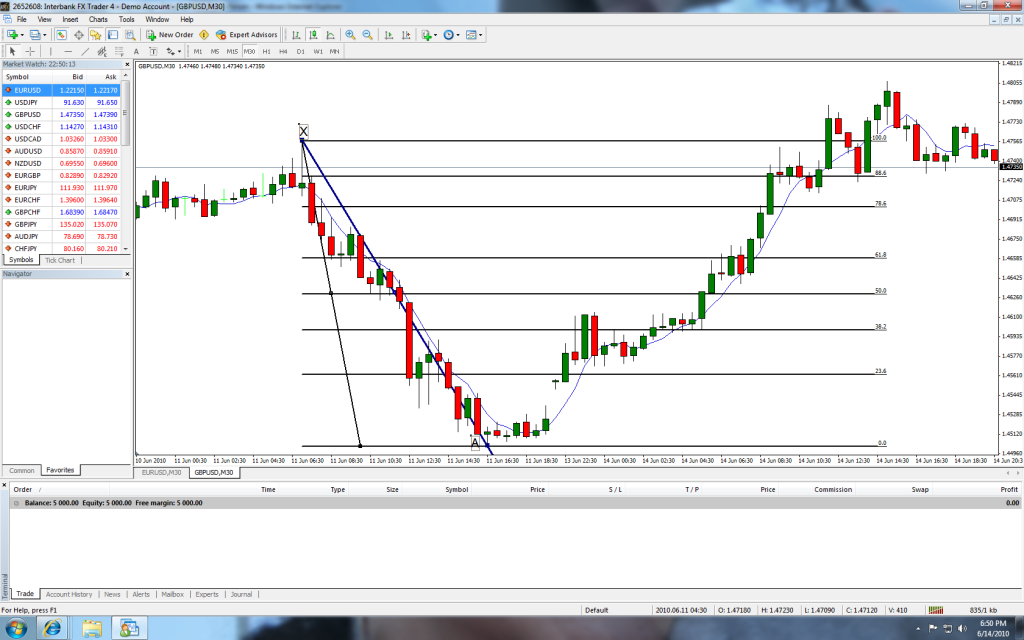
Im kind of new to Forex, have been studying it for a while. I really love this start you guys have going on. However I know i dont have much of a grasp on it yet. I started one and i wanted to know what you guys thought.
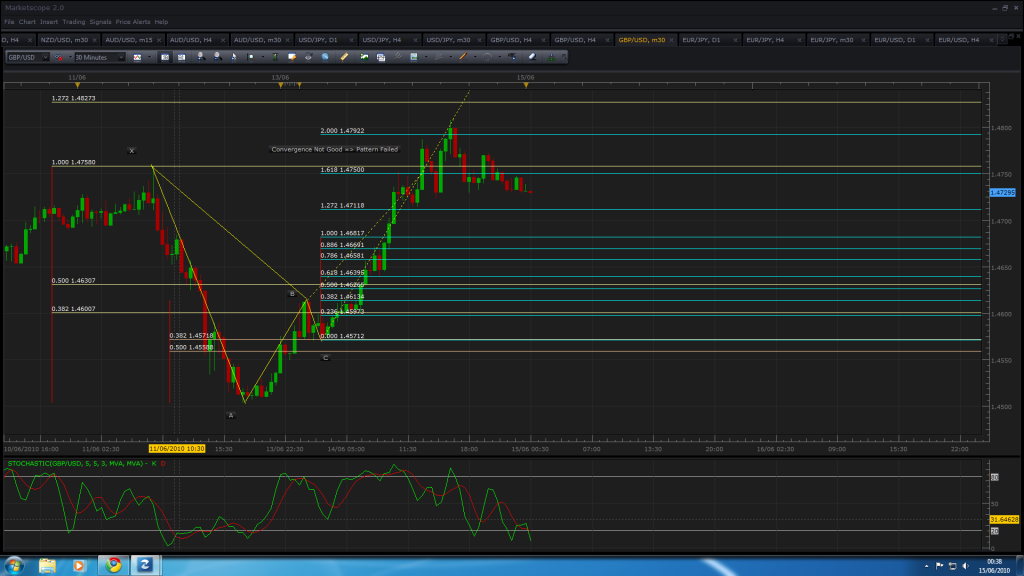
I drew the rest of it out as I saw it. There wasn’t any good convergence however with the closest being around 8 pips at the 1.000 and 1.618 Fib levels. The pattern didn’t work out as you can see.
I’d advise reading this thread from the very start, checking out the link provided on the first page to an FX site that shows these patterns and reading the book that TMB recommends (Trade What You See). Then just have a go at finding patterns and post up here - people will give you feedback.
Ok took another stab at it. As i read this thread more and more i am slowly getting it. I think i can see the patterns easy now. Its just understanding them and reading them correctly that i need to get down.