I’ll post up later at home a more correct version of what you’ve done above though I don’t think there’s a proper pattern to trade off there. At the moment you’ve picked incorrect points to start and Fib levels. Also your CD has to be at least a 100% extension of AB - no exceptions to this.
Have a read through the start of the thread again and check out the youtube links that TMB put up. They’re a handy step-by-step guide to picking your X point and how to add in the Fibs in a correct manner. Just takes some practice and trial and error and you’ll get it.
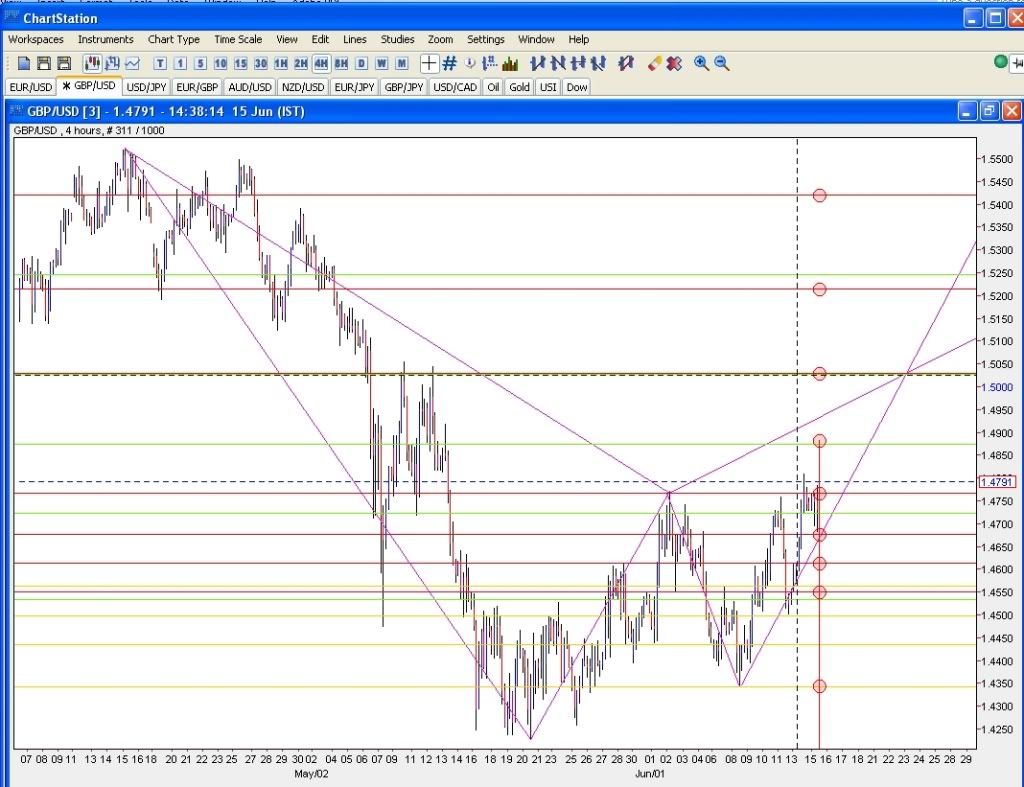
Upcoming GBP/USD bearish pattern, two patterns both lead to the same point (one 4h and one 1h) both with good convergence, will post it as I have time. The D will form around 1.5019
That GBP/USD on the 4H looks a good spot - cheers. I’m using NetDania in work (i.e. looks horrible) and it looks like the D is at 1.5029 with a convergence of around 1 pip. Probably not exact as can’t adjust Fib levels properly with this tool.
This price served as resistance on May 10th & 12th when it double-topped so may do so again. Definitely one to keep an eye on I’d say.
I’m currently looking at the GBP/JPY, D occuring at around 136.36 on 30 min and 4hr charts, if the pattern doesnt complete between 23.00 - 01.00 gmt then I wont be entering (to avoid fakeouts) .
nice work annihilator, ill be watching this pair too, might even go for 3 x 30 pips today :eek:
Oh by the way i got your post about price range and convergence, it makes sense, surprised i never looked at it like that.
Hopefully I will be compiling a document soon with every piece of information that Tmoneybags has written in this thread, giving lots of tips on how certain pairs behave, which fib levels they mostly react too etc and other important stuff that he has discovered from experience with this trading method. Got about 30 pages left to get through and then ill start putting it all into a more structured format before posting it on here.
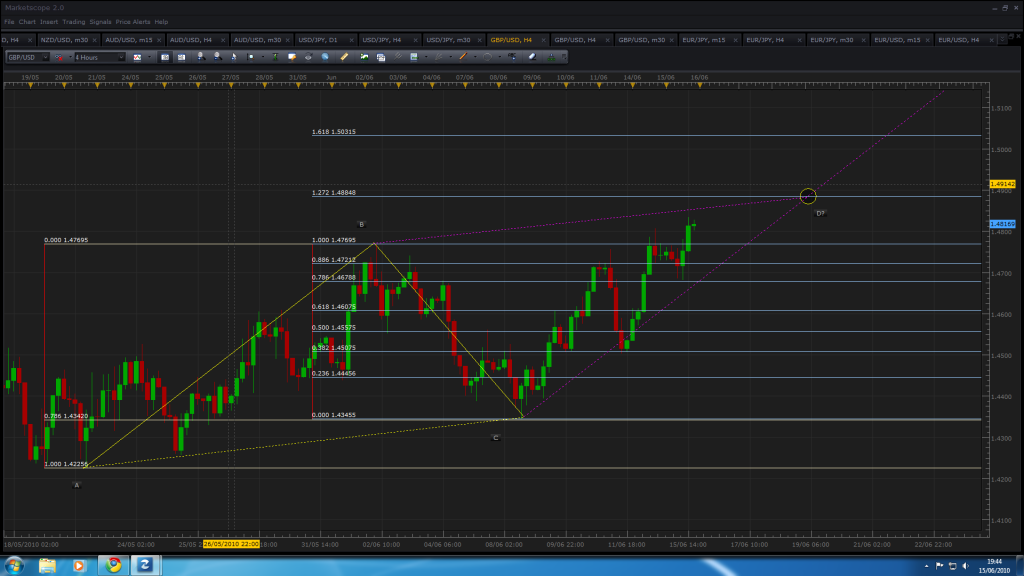
Here you go, I would have posted this when it happened but I only caught it when it retested the D. There were a few successful patterns before it aswell which made it a more likely candidate…
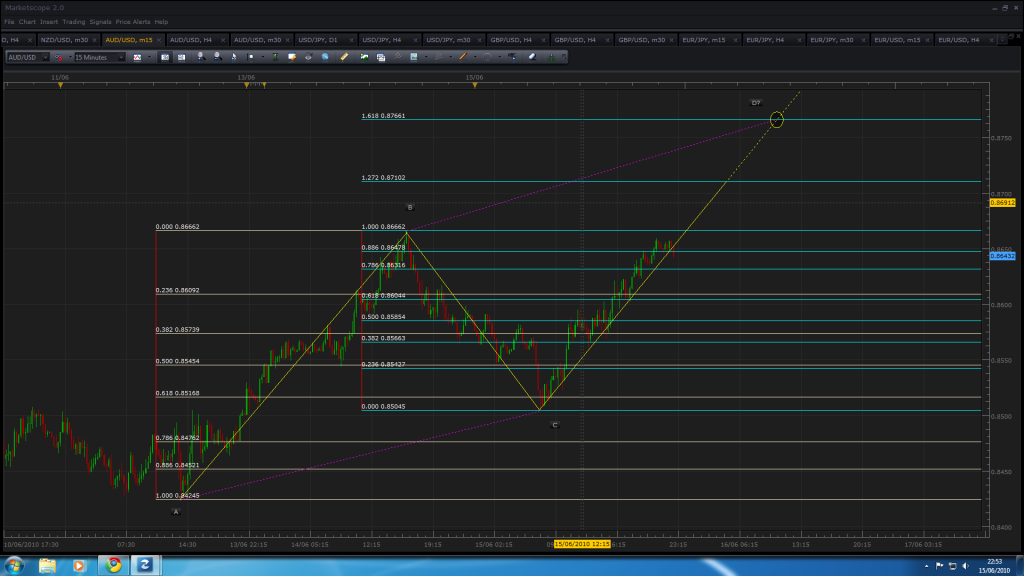
AUD/USD - 15 min chart. Maybe a “Classic” bearish ABCD pattern forming with a D at 0.87661. Little bit dubious about it reaching there in the timeframe but Asia stock markets might well rally up after the +2% gains across US markets today. This pattern could be a bullish Gartley forming too I suppose.
Thanks a lot naughtypip, I missed that somehow. I don’t know if I have said this before but there is another GBPJPY pattern (this one is bearish) with a D around 136.4. It will probably be 5-7 hrs before it reaches the D point, though.
I’ve only just started drawing these patterns but I had noticed that the Yen crosses respected the levels well on the ones I was drawing. Good to know that this has stretched back some time.
Yea i’m gonna put an order in for this while I’m alseep, hopefully it will trigger between 5 - 8 am gmt, (less chance of it faking out)
I agree with you on the yen pairs, im watching these more and more so because of this. I also record all my trades as you do, eventually ill compile this data and post it up on here. :o