Well I’m not experienced and I don’t know how much this stretches back, but it looks to me that you could trade swings according to Fibonacci and still would score above 50% and make some money.
In my whiteboard (which I started using only a few days ago) there are 7 "Success"es and 6 "Failure"s.
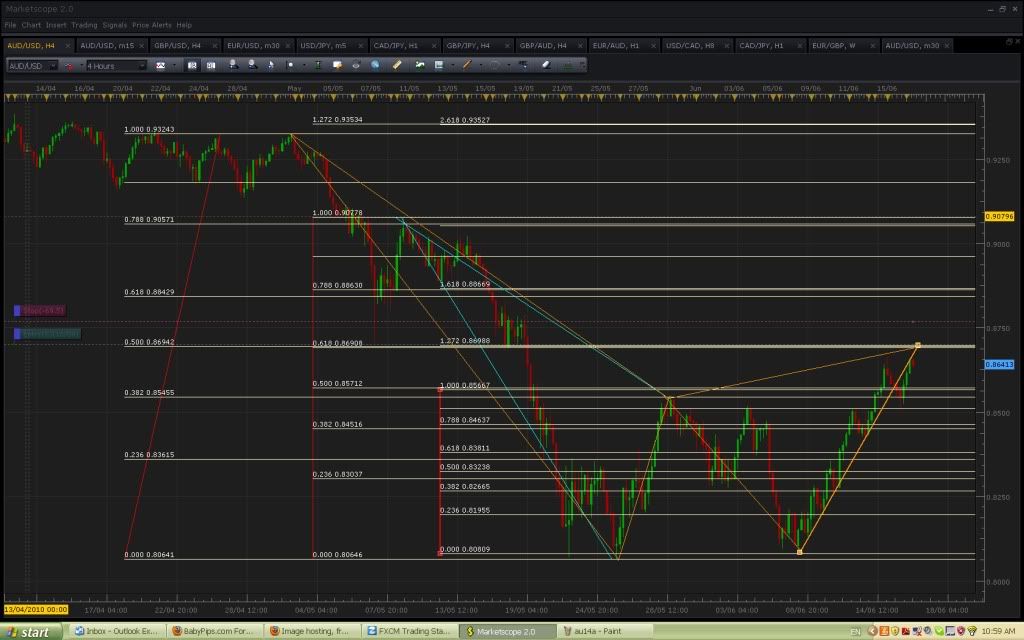
5 of those successes involved pairs with JPY. None of the failures did. AUD/USD failed exceptionally, with all three patterns failing.
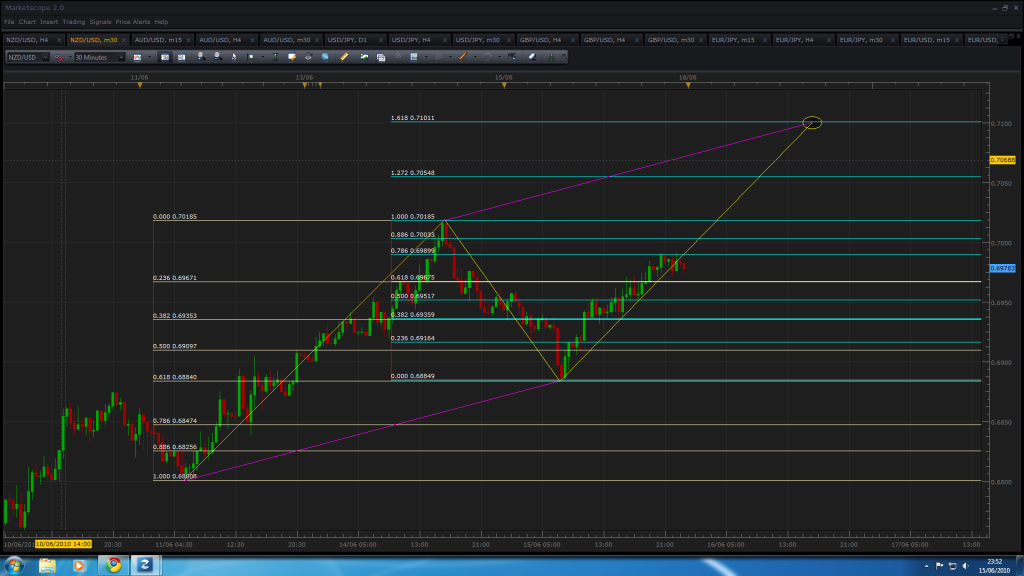
Another classic ABCD on 30 min NZD/USD. Though after the rally off the low a week ago I’m doubtful it’ll complete the pattern myself. I’d be more expecting a bullish gartley to form but I’ll keep an eye on it to see how things go anyway.
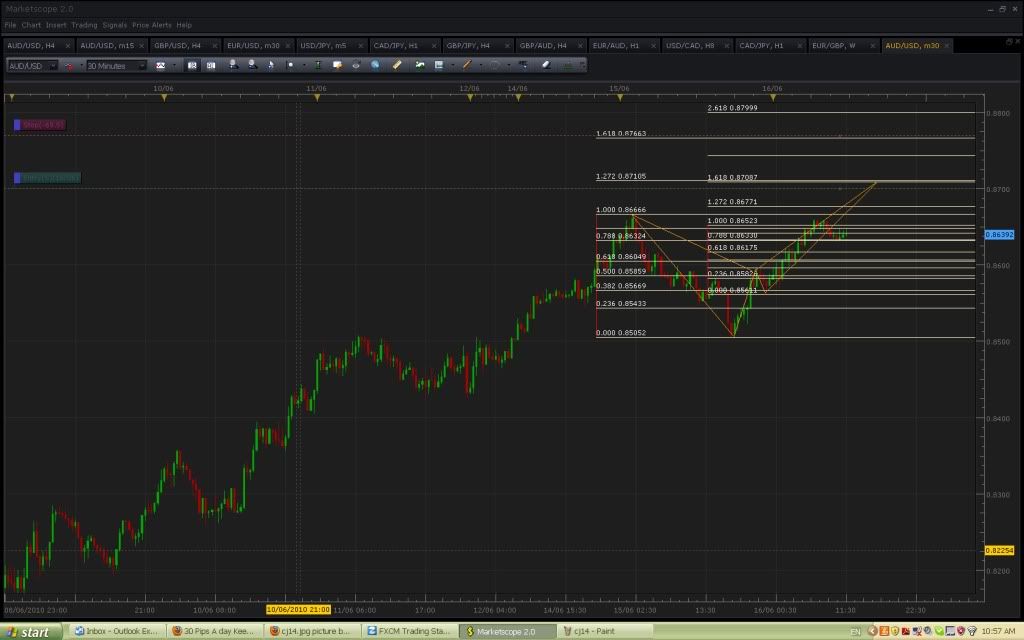
Yep. Now saw it, thanks a lot. Both XA and CD at 1.272 Fibs, right?
When you look at the XA fib levels, you can see that at nearly every Fib level there has been some resistance so this is something to definitely keep an eye on. Thanks again!
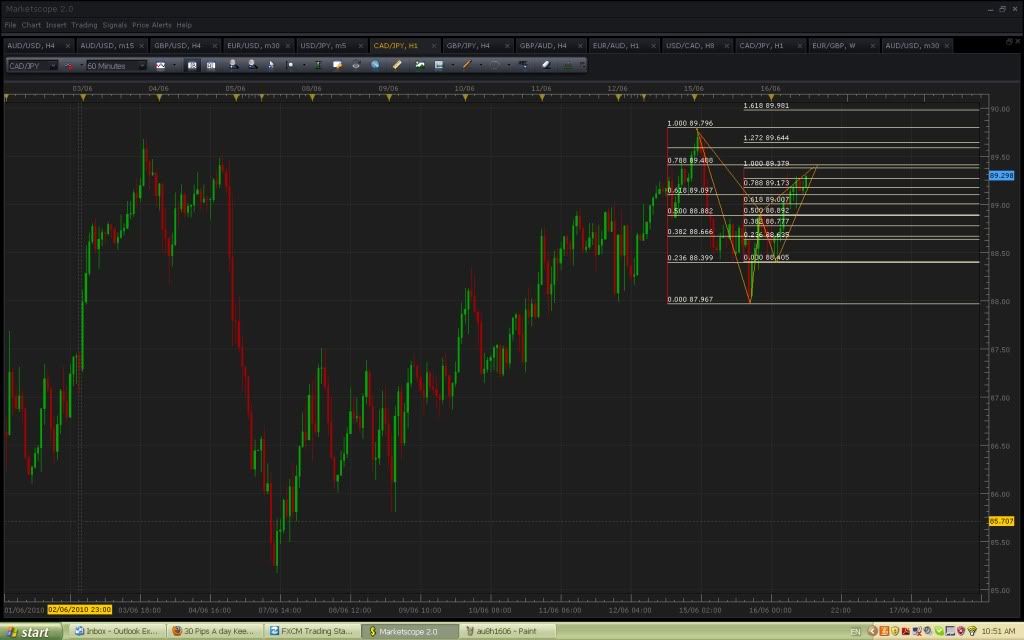
Modo: I’d say a 3 pip convergence is very good, and I am seeing an older resistance line around that point (maybe slightly higher than that) so I think that is a good pattern.
However it’s not a real 60min pattern, it’s more like a 15min one and looking at the low price difference between the X and the A point, I think there aren’t a terrific number of pips to be made from this one.
But I’m keeping an eye on this (to add to my statistics).
cadjpy could be a blowout, be careful, i’m using a very tight stop. we have a bit of aussie data out in 20 mins too. if the aussie breaks higher the cj will fail.
As you can see from the board every AUDUSD pattern I have found has failed. So I’m a bit wary of the pair, however I’m not trading with real money so no problem, haha!
/So do you have your win/lose statistics aswell? Id be interested to know your average gain/loss. Funny I use to print out daily/4hr charts, label them in pen, and hang them on my wall. It actually really helped me out though.
I started recording them a couple of days ago so whatever you see on the board is all I got.
On my board, the criteria for “Success” is a gain of 30 pips without hitting the 20 pip stop loss.
And the criteria for “fail” is to hit the 20 pip stop loss before giving me a gain of 30 pips.
So, the board shows a total gain of 30x7 = 210 minus 20 x 6 = 120, which makes 90 pips. Funny thing is this was achieved in 3 days which still makes “30 pips per day” (keeping the money at bay :P)
I will not be trading AUD/USD from now on (3 tries, 3 failures) but I will continue to monitor them and add them to the record. So my “total gain” figures from the board are not equal to what I would have gained if I was playing a live account (if that made any sense to you)
This has put in a bearish candle formation just short of D. Looks like it has played out, I won’t be taking any re-test.
Another riveting asian session (yawn). No trades for me, maybe I should have been more aggresive with the yen crosses. Will leave an offer in for aussie around the figure.