I think a decent pattern is forming on the 4hr chat of USD/JPY. Im still learning this though. Convergance is still my weak point and finding the true D.
I got point C at 38.2% of AB. Is that to high?
Never mind i failed to see that from A to B it blows pass the .382 many times. Thats a no no from my understanding right?
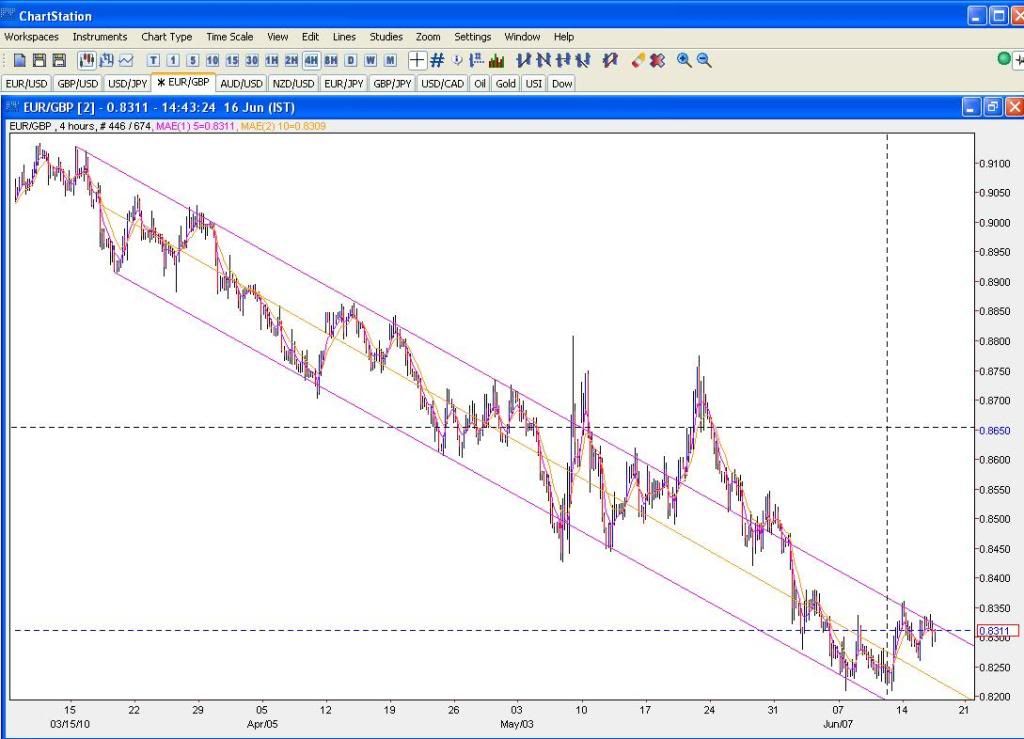
looking at my eurgbp charts again. on the daily, and 4 hour charts Im noticing a decent convergence around .8440-.8450, to add to that there is a pretty good line of resistance in that spread.
Ya and maybe you can help identify what step im doing wrong lol.
First i find an extreme for X. A will be my next point where the market makes its next big change. Then i put a Fib from X to A. I look for B at the .382.
Now i C and D is prob where i am messing it up. Last night when i did this, i was pretty sure my point C was not higher then point A. After i woke up, point C looked to be different and higher then point A. And i thought point D would be where a fib from B to A then put it at C, and at the 100% of that converges with my X to A fib. Is that about right?
Point B can be anywhere above .382 (or in your example lower) so long it is the next extreme and s longer that is no higher (or in your example lower) than X.
Point C is your next swing high or low, and cannot exceed but can be equal to A.
D is is then projected from these points using the convergence.
I wouldnt worry about convergence yet id just concentrate on getting the patterns right since the convergence is useless if your patterns are wrong.
Hello again everyone, it looks like there is a 1pip convergence in the EURGBP 30min charts around 0.8359. The fluctuations are not very wild so maybe it won’t be enough to make 30 pips but I’m waiting.
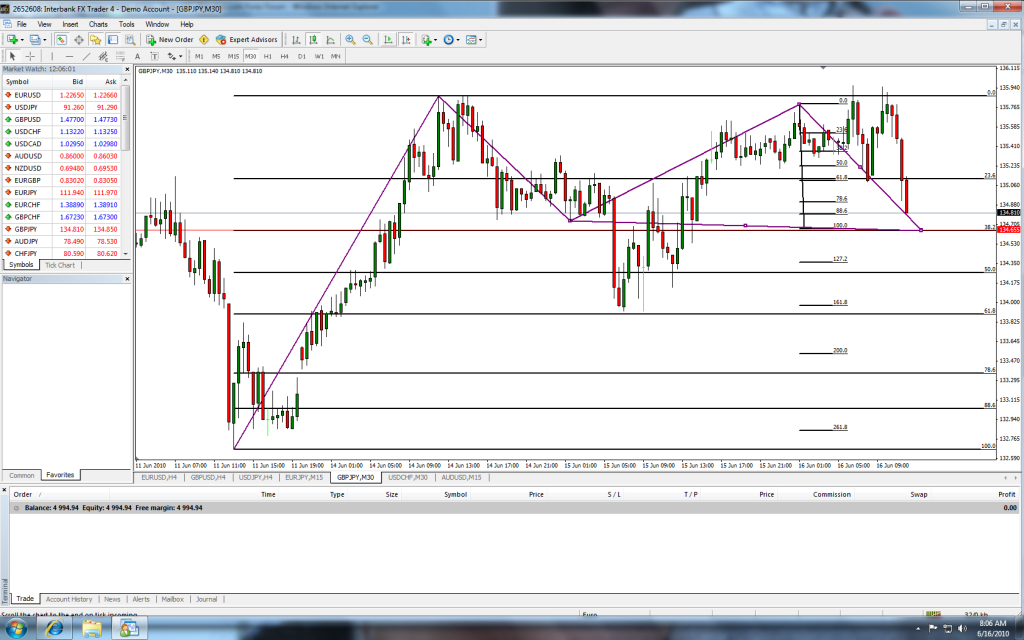
The gbp/jpy pair we were looking at yesterday on the 4 hour and 30 mins still hasnt reached its D, there may be another pattern forming on the 30 so heres a heads up:
Convergence aint that great, 5 pips, but if price makes it past the .618 fib, it may bounce at the convergence and lead us to the bigger pattern which would make sense. . .
Yup found that link last night. Its a very awesome read, now i am just trying to get it right lol. As i read this thread more and more i think i am getting better and better at it.
So i got my XA and B right. The next swing was closer to B then i had it right?
Lol, only your A point was right. Willworkforpips has pointed out the correct placements of the points.
Your point B needs to be at the next lowest point in price, which it wasnt, then C would be the next highest point, so long as it doesnt exceed A.
Point X is a difficult one because it can be a number of different swings really, but is usually most valid at the the most extreme point in price, and knowing which x to choose comes through gaining ‘a nak’ for this method, (which I myself dont have yet)
It really would help if you read from the beginning of this thread because that is the point where everyone is learning the basics of these patterns and having similar problems, rather than me going over stuff already covered.
Tell me about it, i feel like i need another screen for patterns Im waiting on to separate the patterns that have formed D’s. Come to think of it, I dont have any patterns that have formed D’s yet. Doh
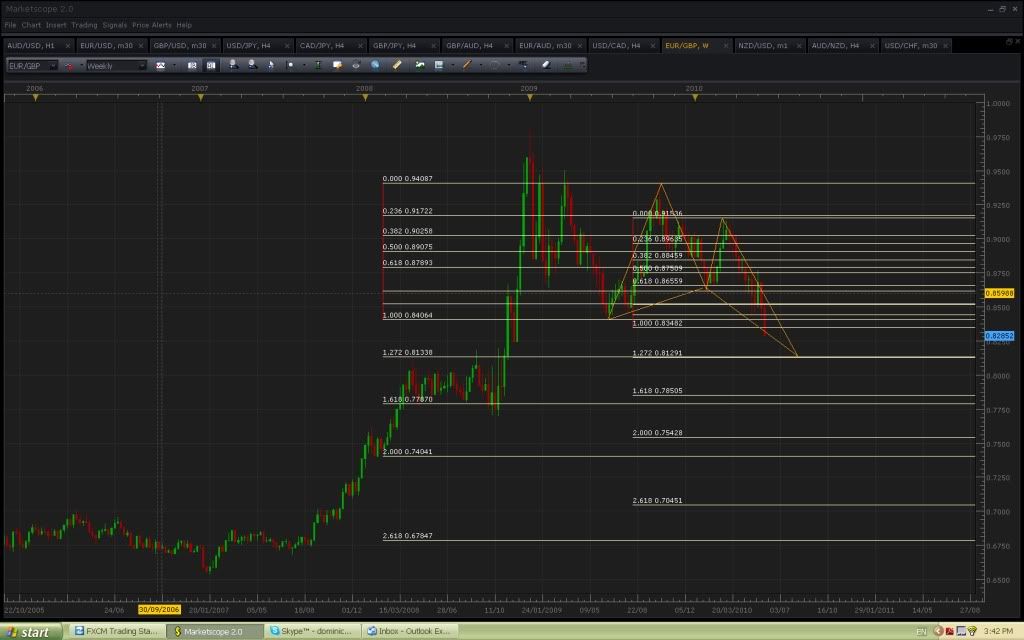
Looking at this one also, it convergece with a daily pivot so the resistance is strong here. We will see if the price make the D Sorry for not posting for a while, been busy moving to another town
//Chris
Im still watching this pair. My downside order is currently .824 from a 1 hour chart. Topside orders at .8358(1hr changed my order from last night due to lower c), and .8442(4hr/daily). Really lke the way its respecting fibs.
I chose point X by drawing multiple fib levels on different scales, and seeing which fits best with the chart at hand, if I cant find a reasonable one I move on.
Definitely. I wanted to talk about this earlier but I forgot.
We choose X’s because the swings/rebounds should follow its Fib levels. This means that we have to choose a X that will produce Fib levels which fit with the chart swings.
I’m still hoping eurgbp gets down to here, then I will start looking for longs. And btw, I don’t think I will take the short euro pattern I posted earlier today…think it was rubbish.


 Sorry for not posting for a while, been busy moving to another town