30 Pips A day Keeps the your money at bay

This does apear to be a nice pattern. Good enough for my money anyway.

Does anyone here have any experience trading from point c? Ive been studying forming patterns, and c seems to be a pretty easy point to pick. Picking a tp point from there may be the key. The sl is a no brainer.

Been watching this for some time myself. Also, after weeks of waiting it looks like the eurgbp might finally hit D at .8125.

Maybe a 3-Drive for the GBP/USD 30 min chart? Seems to push past the appropriate Fib levels a bit all the way up so might continue to do the same for the last point.

No, I use a different stop strategy (next XA fib).

The first loss on the ej chart was from a different (but equally rediculous) pattern. The second was a hail mary trade, only gave it 30 pip stop as I only had 0.2% left to trade for the day and was hoping D would hold almost to the pip. So this was a break of my next XA fib rule, and was an alarming break of my trading plan. As it turns out the next fib was violated anyway, but this is little consolation.

As for the uj, I was using the next XA fib from last weeks hourly butterly (90.02), and taking shorter term patterns in that zone. But didn’t have a clear higher timeframe picture, and should have been taking some profit when up 100 pips.

When this strategy works it works big. Last week I booked 530 pips from the gu, but there is quite a lot of dissapointment too. Most of my trades are moving into the money, but lately few are hitting my first profit target of .236AD.

This week, I closed my short au before .236 which is another breach. And the uj hit.382 and not only did I not take any profit, but i did not move my stop to breakeven (which i can do when .236AD is met). This is called greed.

The one good thing is that i kept to my strict and conservative money management rules of max 0.5% loss to capital. This keeps me from entering the death spiral and ensures my survival. Today I have a clearer head and will try to make it back slowly with high quality patterns and better discipline.

Very nice PipBandit, thankyou.

Yep, watching this too and will probably take one more shot. Daily trendline support around 89.50 but scared I will take another loss on this pair revenge trading.

Had a similar problem. Here’s what worked for me. I always take atleast 2 positions on any trade. somewhere in the 30-60pip+ range I take profit on the first position and move my stop to 0, or light profit. about 80% of the time I get my first target. I lose alot of second positions to break even, but usually every week or two Ill have one go well. This really helped me quit losing.

Yeah, I do scale out, but the first is at .236AD and i can’t move my stop to breakeven until that point is met. So on the bigger patterns this can be a lot. I can sometimes justify earlier exit on the basis of shorter term patterns, in the same what that i can justify a smaller stop into a bigger pattern on a smaller timeframe pattern.

My reasoning is that you want to give the trade as much room as possible. I know not everyone will agree with this and say you should lock in profits or at least move to risk free. But i feel that some trades will go like clockwork, hit D and never look back, others will be a lot more difficult, move in and out of the money, flirt with your stop etc etc…i don’t need to tell you guys. I set my failure point at the time of entry and this will rarely change just because price doesn’t move in my direction in a straight line.On the weekly long cable this strategy kept me in a trade that would otherwise have broken even. Twice I endured pullbacks from +200 pips to 0, which was difficult psycologically, but this is where there real discipline comes in i think. I find holding on for my limit a lot harder than any other area, and even on this cable I exited 100 pips early of my .236 limit.

So we are all different. Not saying for a moment that TMB’s strategy is not great, but I was not good enough to hit a high enough % to make the 30 pip profit target work for me. I also prefer a set and forget strategy and not to have to manage my stops. The 30 min candle rule also confuses me somewhat in the sense that what if you enter on the 29th minute of the candle…do you then close 1 min later if it closes negative past D. If someone could clarify that would be great.

Interesting, Ive been using the previous fib level of xa for my tp. I exclude .886,and 50. I use that because every pattern I trade using this has to have used fib levels of xa as support and resistance(i rarely trade patterns that dont). It also helps on smaller patterns where 30pips may not happen. I lowered my tp today for eurgbp because it overshot by 10 pips making my pattern invalid(although it still hit it). If I think its a complete reversal those rules get thrown out the window, and I let it run until I find a good reason to end it, or use a fib level from a much bigger picture. It would be interesting to hear how other people have adapted this system. As far as stops go, Id rather pay for them up front and reposition then let them go. my standard stop for this is 15pips 1hr, 30 4/daily. That is unless a big number comes into play(psycological, or pivot) then I put it 5 pips on the otherside.

Possible bearish Gartley forming on EUR/USD 30 min charts. Don’t fancy it to get up there in the timeframe myself but I’ll keep an eye on it just in case.

well I think it’s a bit early to call that even a CD leg :smiley: but I’ll keep an eye, thanks.

Definitely too early to say yet about the CD leg but figured I’d throw it up there anyway as a “maybe”.

All my attention is on GBP/USD at the moment. Came within about 15 pips of the D on the 4 hour charts. Perhaps should’ve entered manually as it’s struggling with the 1.50 level right now but I suppose it’s better to stick with the plan in general for the long run.

I will be just trading swings to .618 or .786 for some time. I really wonder how it’ll be. It will definitely mean a lot more trades than the Gartley / Butterflies but it’ll probably also mean a lower success rate.

I have read most of “Trade What You See”. And from that book, it seems to me that we are constructing our charts in a very doubtful manner, especially the AB=CD legs.

Annihilator, can you expand on this?

Well let me say this. For the last 2 days I have done an extensive analysis into 8H and 3H USDJPY charts (past charts).

For the 8H charts, I have identified 11 patterns, which are all correct patterns according to TMB’s method. 6 succeeded, 5 failed.

For the 3H charts I have identified 15 such patterns, of which 8 succeeded and 7 failed.
In addition to this, I have a whiteboard in which I wrote current patterns as I saw them. This indicates a success rate not much above 50%, either.

Clearly, this is way below the touted “70% success rate” for this method.

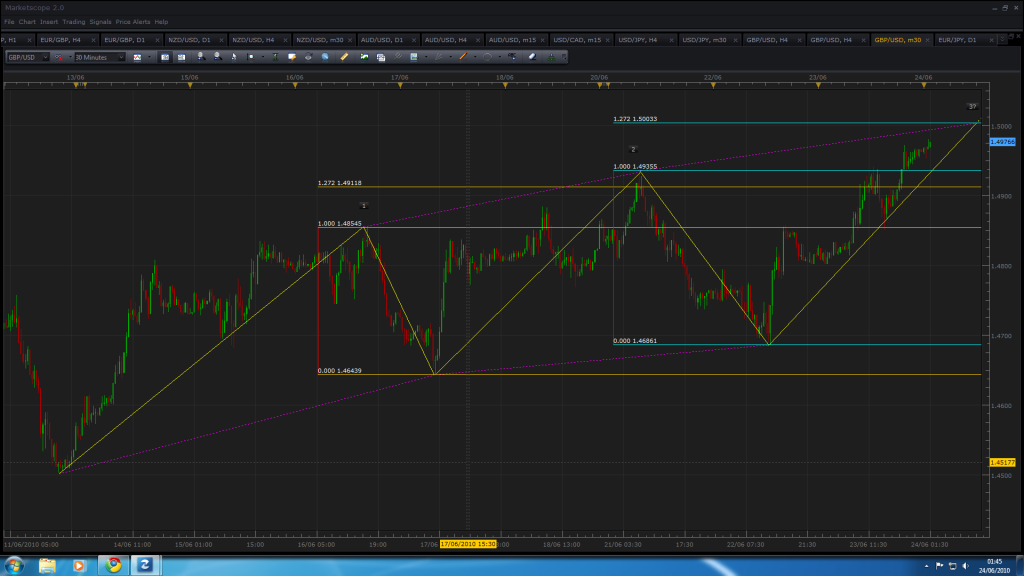
In “Trade What You See”, the AB=CD legs of the patterns are usually very symmetrical - they are both symmetrical, and are clear-cut in terms of trends. Let me try to open it up with an example.

The way we are doing it, we are choosing the B point as an “intermediate extreme”. This is correct but is not enough. There should not be a lot of swings before the B point. The line AB should not contain a lot of swing highs and lows. It should mostly be an uptrend (in case of a buying pattern). At least this is how nearly all of the examples in the book are like.

At the heart of this method lies the AB=CD pattern. And the pattern itself should be “pleasing to the eye” as Pesavento himself says. So I think we should choose AB=CD’s that don’t “stall” if you see what I mean.

Plus, and this is mostly cosmetic but, in the book each pattern leg consists of 5 to 20 bars. We are usually talking about 100 bar legs in our examples. This means that we have to go to a higher timeframe and just zoom. I absolutely know that this sounds silly, and what I talk about only means subtracting information without changing the extreme points :slight_smile: Just pointing out the difference between what we are doing, and what the book talks about.

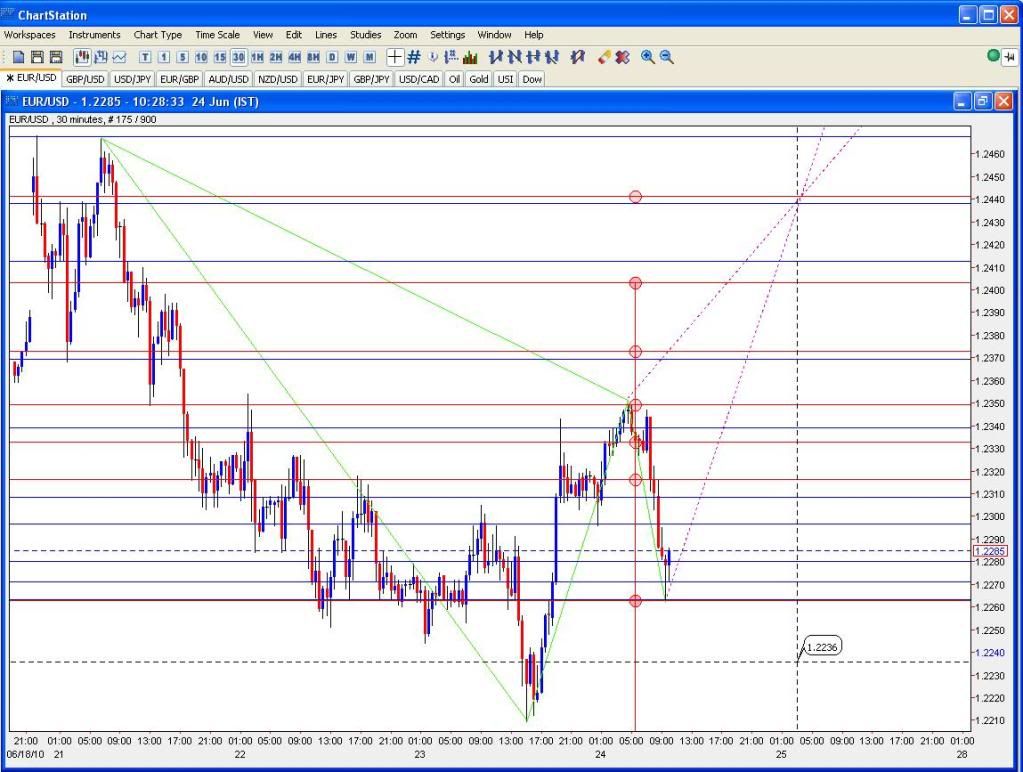
[B]The AB=CD leg is very important.[/B] From what I see, we are missing on a lot of successful trades because we are looking for the additional XA fibs confirmation. And the XA fibs are important S/R points too no doubt about that, but from what I have seen, the AB=CD fibs are more powerful.

I’m going to trade swing fibs and AB=CD patterns for a time and let you know how it goes.

thanks for the response annihilator.

I too have become slightly demoralised by this method at the moment, I wish TMB would pay a visit and give us some pointers. I am bewildered at the profits that he was making with this method while he was posting and how none of us ‘thread followers’ seem to be able to pull off the same results.

Keep us updated with your abcd’s anyway.

TMB’s first accomplishments were incredible. However, the fact that he needed to “tweak” his method later means that his method later started to perform worse than it did once. I really wish he would tell his new, tweaked method here; but can’t complain because he doesn’t. After all, he introduced many of us to one of the most powerful trading methods.

The ABCD pattern is a good one from what I’ve seen. I’ve been looking more at these lately as the ones that I’ve done have worked out better on average. I’ll post them up as I come across them.

The ABCD pattern also has many “intricacies”. For example it might be 1.00, or extend beyond and reach 1.272 or 1.618. To determine this, we have to look closer at how the BC leg is formed, the number of bars it takes for the legs to form etc. This is good - the ABCD pattern is very powerful and studying on it should be, in my opinion, better than forming random Gartleys or Butterflies without much regard to symmetry or price action.

Obviously the best would be forming XABCD’s at the same time closely examining the ABCD’s within it, but as I said to do tha you first need to study ABCD’s closely which I will be doing for some time now.

What we are looking for here is an AB=CD pattern with an ab=cd contained within the CD leg(we can also have one in the AB leg). The extra convergence we look for for this pattern just gives us an extra point of comparison that makes these more accurate then standard AB=CD. We use this as the most productive pattern because the end of cd could be an extension anywhere from .618-1.618. I believe the book in question is mildly flawed in that it doesnt take .382 into account in high pressure markets, however .382 patterns can lead to .618-.786 patterns, so maybe Im just impatient. .886 is also another valid #, but should be used with more caution then the primary numbers. In any case finding patterns where the ab=cd leg conforms to the xa(or first AB) legs fibs will yeild the best results.

Edit: Sometimes we’r also using an ab=cd leg in bc to project point c of cd. Which leads me to something Ive been considering… ANy good reason why we cant just take the action at the easy to see happening point c? Also TMB’s method is successful due to the 30pip rule. He’s just catching bounces, not reversals. I think he is trying to catch complete reversals with his new system.