My thoughts for what they’re worth as just a breakeven trader.
This method is essentially a retracement method. You have an impulsive move (XA), and are looking for a retracement in that move to buy or sell (D’s past X can be considered external retracements). Some people would do this by simply applying fibs to XA, but how do you know which fib retracement to choose? This is where the abcd comes in. If you can find convergence of the termination point of an abcd pattern with one of the XA fibs, this might give you a better idea of which fib retracemt price might find support.
So in my opinion labelling these patterns gartleys or butterflies is slightly misleading, and is the reason many harmonic traders believe the patterns on this thread are rubbish. And lets face it, a lot of them are (many of mine), but not because they don’t conform to the accepted gartley or butterfly proportions, but becuase they do not posess a clear, symmetrical abcd pattern (“good to the eye”).
These patterns should be used in combination with other confiming factors such as trendlines, candle formations, indicators you like, or preferably all of the above. The trade should be a good trade on a stand alone basis, regardless of the pattern, and the pattern can serve to maximise your entry.
As for TMB’s results, I would encourage everyone to look behind the absolute returns and think about risk adjusted returns. Obviously TMB’s returns are outstanding and I congratulate him on them, but you have to consider the risk that was taken to achieve them. The only mention of money management I can find on this thread is 5-10% of margin per trade, which is huge in my opinion. At the start of this thread TMB is taking 20k positions on what I assume (perhaps incorrectly) was approx 5-10k account. Again…this is huge! Trading this size you may burn bright for a while, but the odds of blowing up are enourmous. Indeed, in post # 709 TMB did appear to whipe out his account in one session (and was good enough to share this). That’s what can happen. Returns of 5k-15k in 2 months or 60%/month are impressive at first glance, but should ring alarm bells. You simply do not achieve returns like this without considerable risk. Returns of this magnitude are extremely difficult to achieve at all, let alone consistantly.
I’d agree with the above. Whenever I try to draw the patterns to try and find potential D’s I always extend the lines in the ABCD style so the symmetry is good. If the symmetry is off by a fair bit I file the pattern under “suspicious” in my head and don’t trade it unless there’s a combination of other things backing it up.
These patterns are relatively simple to grasp and don’t require any real specialist knowledge or skills. As such I don’t think they can be relied upon on their own. If things were this simple we’d all be millionaires.
I agree with you completely modo. I think the reason most of us are here is because there arent any other real harmonic trading threads on this forum. As far as TMB’s risk ratio goes, dont do that. For me 2 positions with a 15-30 pip stop is less then 1%. In my opinion thats how you should trade. I do agree with his exponential growth idea though. Add another position for every 10k in your account.
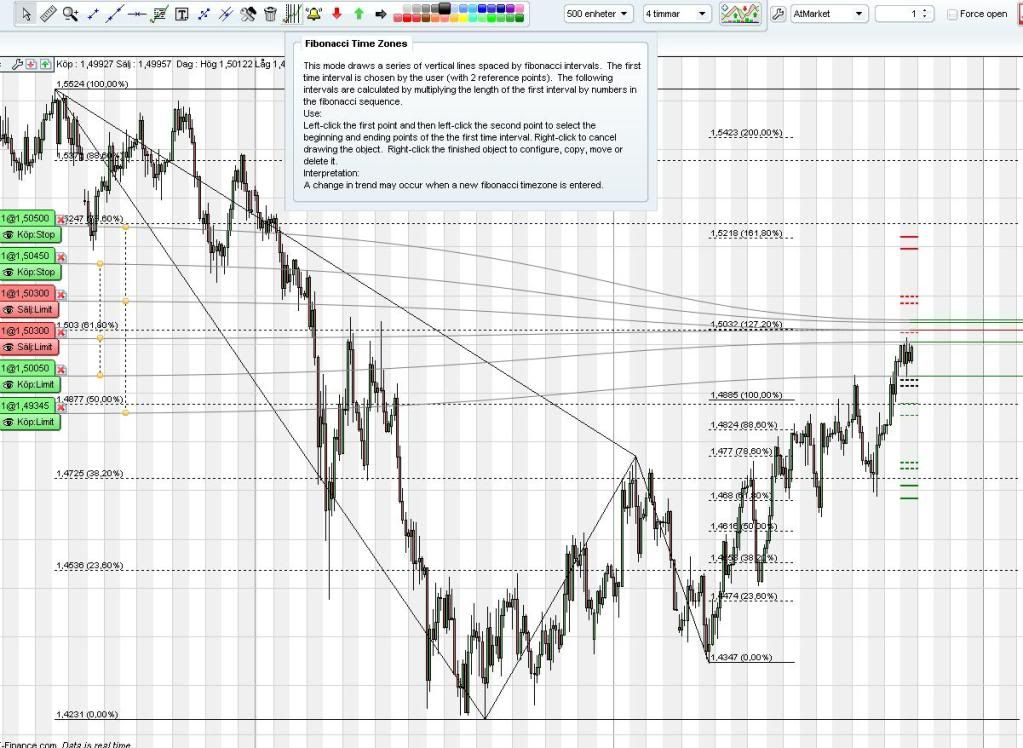
That you need to combine this patterns with other setups is something i agree with. Like you might have seen in my Charts i use Both pivot points and Fib time zones. Plus i am very conservative with the patterns i take. For me a D must converge with a daily Pivot to enter the trade and if the pivot is close to the fib convergence i rather take the pivot as an entry. I do this becouse price often reacts violently at the pivot points. I try to find retracements zones with great resistance and thats why i want the Ds to convergence with the Pivots.
i Use both (H + L + C) / 3 and (O + H + L + C) / 4 to calculate my pivots. I use this so i more often will find convergence then if i would only use 1 pivot calculation.
The Fib time zones i use to see if the pattern is harmonic and if the X movement gives support to the D. What i mean with this is that i have the ordinary fib lvls that we use, calculated in the fib time zones and i measure the XA leg and i move the time zone to the beging of the AB leg. The i try to see if the price turns is “Harmonic” in time compared to the XA leg and for me to trade a pattern the D cant be beyond the 261.8% of the fib time zones. And also i try to find the Ds that is symetrical to the fib time zones.
Dunno if you all understand what i mean but i can try post pics if some one want to
I find the succses of my Ds is kinda high becouse i am kinda conservative with the ones i take. It happens that the price turns befor it reaches my D lelvs but that is okey with me becouse i like the low risk entry cuz i uses tight stops for about only 20 pips. I also try and take some of the profit kinda fast at about 30 pips then i aim for 23.6% of DA and if 23.6% of DA is lower then 30 pips i dont trade the pattern
So we do have a harmonic trader in our midst! I would love to see some more of your chart work. Sounds like we’ve both arived at a similar method for picking the ones we take. Ive flirted with adding fib time to my aproach, but couldnt seem to get it nailed down in a usable fasion, so Ive been relying on fib level respect instead.
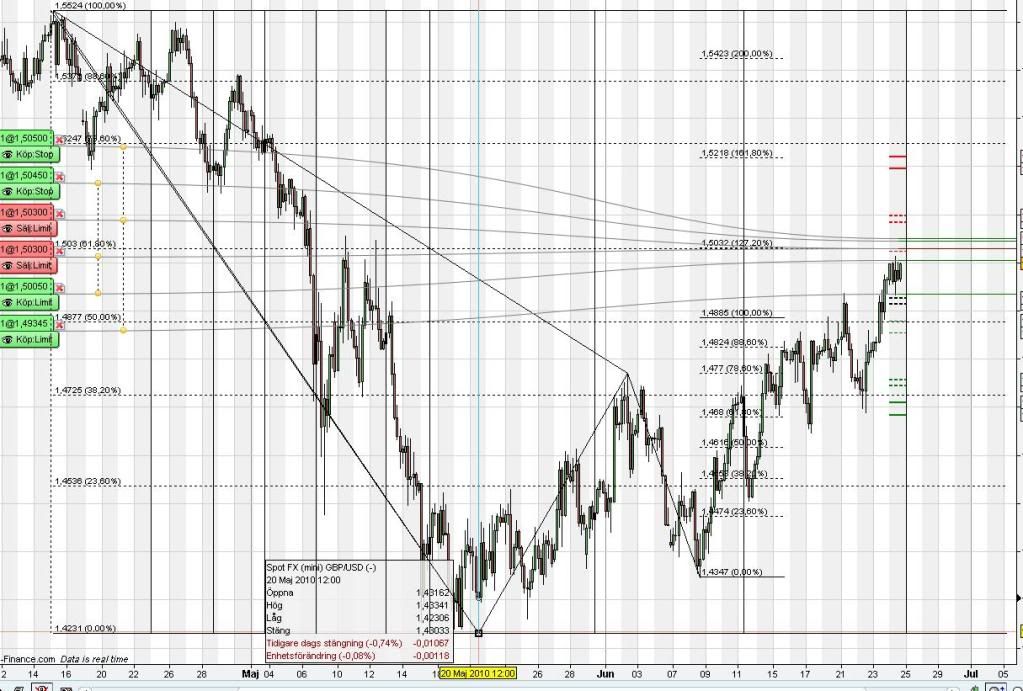
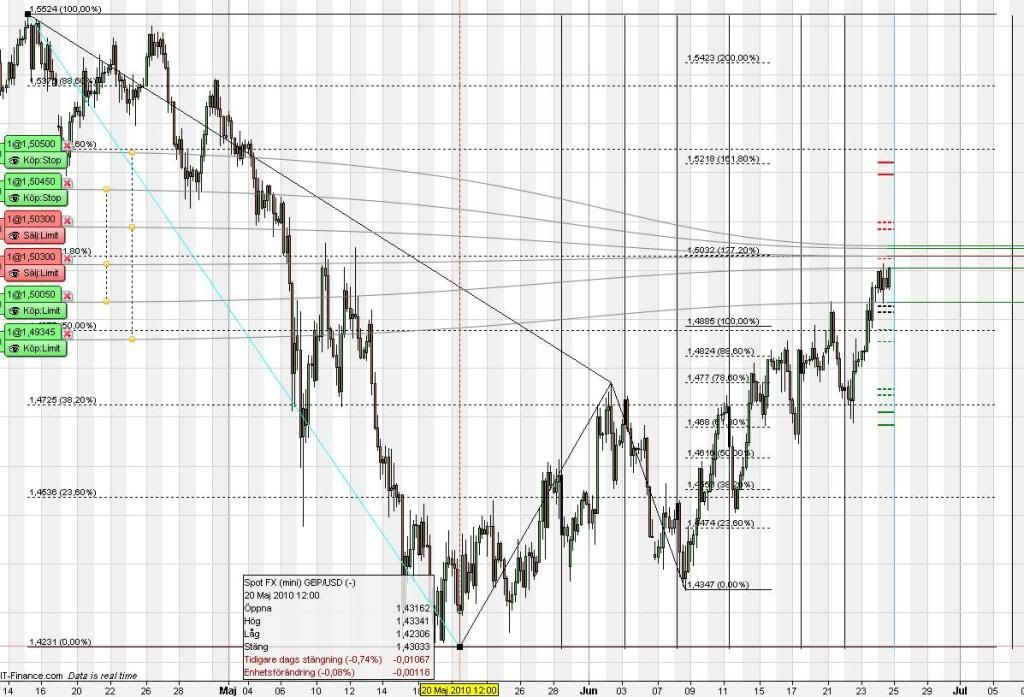
Then i move the FTZ to the A point. My idea in this is that the XA is the fundation for the pattern to be valid. Like the price moves beyond the 261.8% lvl of XA on the FTZ i dont think the XA legs fib resistance lvls is strong enough, did anyone get that?
Now i can see if the turns in the price is harmonic to the XA leg. And if it is really good it will converge with the FTZ lvls.
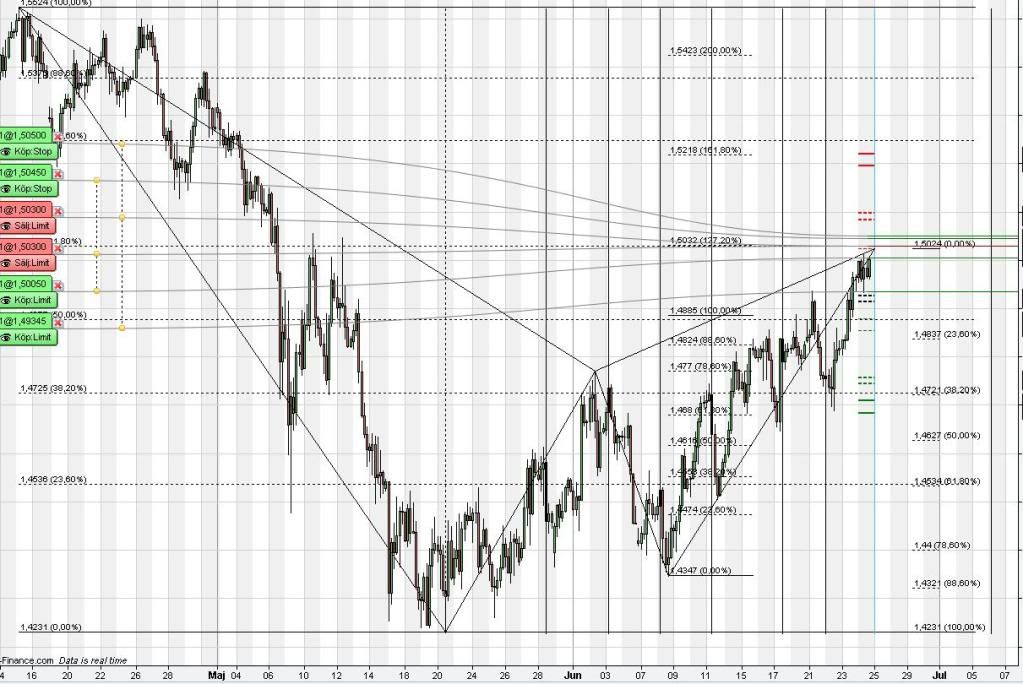
Then i line my CD leg as a support line to the price and tries to find a FTZ lvl that matches the price best. The Blue FTZ lvl is 100% of XA so in this pattern the D should be around that fib lvl.
Good ol’ GBP/USD and the 1.50 level. Good for 2 x 30 pips today.
We’ll see if it reaches up to the ~1.5030 level which would be a level I’d have another look at entering a trade for again sometime tomorrow. With things starting to look overbought on 4 hour and daily charts I’d like to try and open a position which could run for a bit.
My pleasure, im of now until monday, here in Sweden we celebrate midsommarafton in english Midsummers eve Happy trading for you all and ill be back on monday
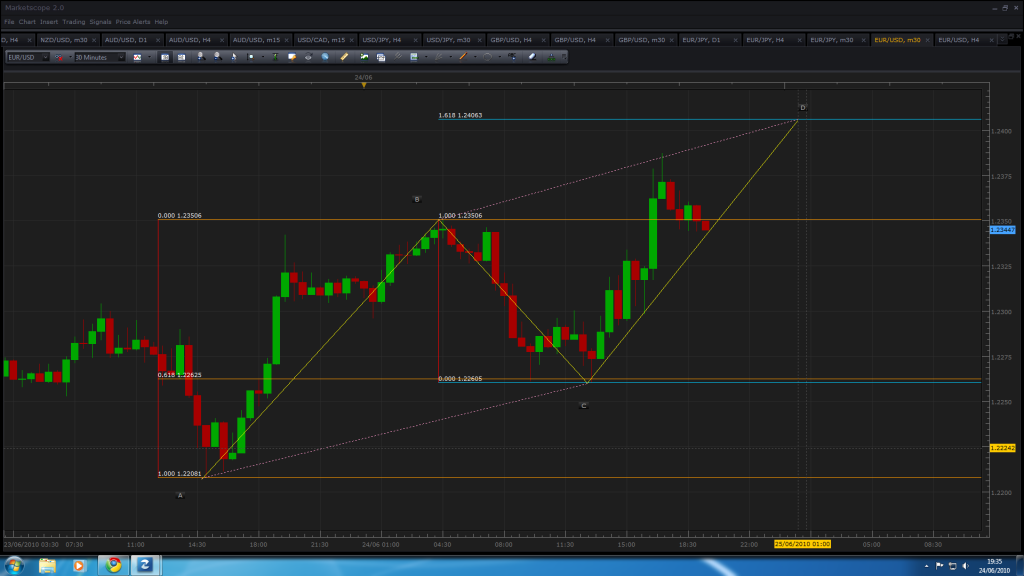
Possible Classic ABCD pattern on EUR/USD 30 min charts. BC is the required 0.618 retracement of AB and the 1.618 extension of BC provides nice symmetry. Just not sure if there’s a catalyst in the market to drive it up 60 pips in the timeframe we’re looking at though.
Been a long time since I last posted anything on this thread. Regardless, I thought that a pattern I found (also complements SwediChris bearish gartley under GBP/USD 4H chart) is good to share - bearish gartley under GBP/USD daily chart. Based on my observation, D is at around 1.5000 - 1.4990.
My order was placed at 1.4990 and going to T/P 100 pips. Seems like there are others taking attempt to profit on this pair going bearish. We’ll see what happens.
Unfortunately came nowhere close for any of our patterns that involved price taking a decent uptick. What with the Asian and now the European markets following the US markets down they were never likely to work out.
Time to move on to the next set and see how they work out.
Actually we probably should be more precise now that I think about it. The patterns didn’t fail. They never formed in the first place. We only identified patterns that were possibly forming. Fundamental factors trumped technical analysis for today it seems.
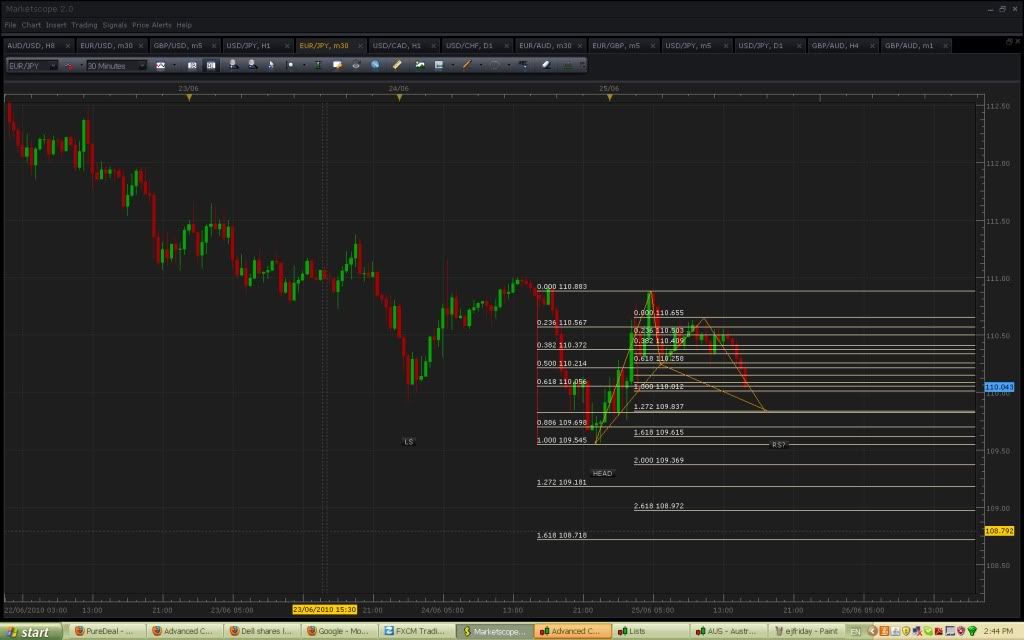
Hope you guys left open orders on modos eurjyp. Thats the second time Ive seen a failed pattern work this week. Also looks like another possible pattern forming on the eurjyp hourly. If that is an inverted head and shoulders it puts the .618, and the 1.618 below the neckline.