that’s right pipbandit, actually those haven’t “failed”. They can fail only if they exist, and none of these patterns reached their D’s.
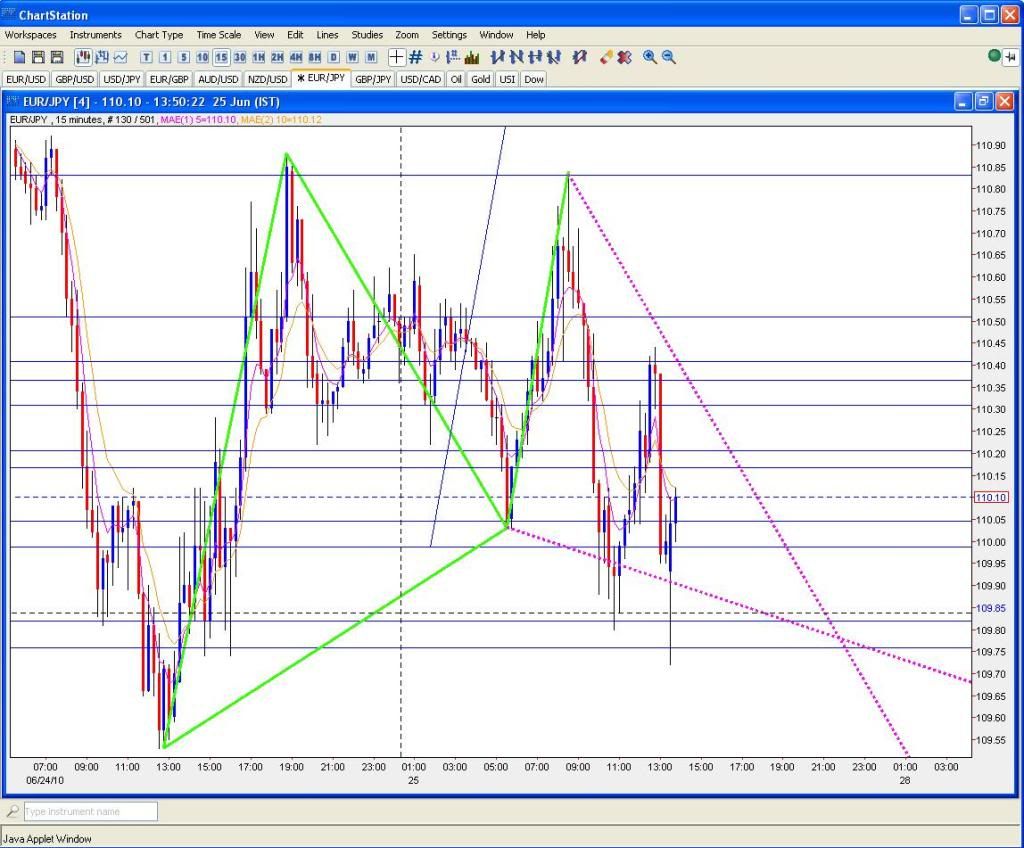
No I’d decided to see how it played out. I’d been thinking that a possible Gartley was forming per the diagram below I’d started drawing a little after 9am but the level was reached very quickly and I decided to stay out of the trade. Taking the trade would have worked out in this case but I’m wary when the price drops so rapidly. Prefer to just wait for the next trade to come along.
GBP/USD approaching the 1.50 level again - has been very good resistance so far. The 100 day SMA coincides now with the 1.5030 D we’d identified in the 4 hour chart pattern which would be extra resistance probably.
Decided to go short at 1.50 but now having second thoughts what with the weekend (and potential gapping) coming up and possible G20 comments over the weekend saying who knows what.
The only reason I can think of though that the pound is outperforming other currencies so much is that people think there might be an interest rate rise in short to medium term to try and counter inflation but I’m not convinced the BoE would do this in the middle of all the austerity cuts to tackle the deficit.
One of those finger hovering over the close trade button moments… :rolleyes:
This apears to be a usd negative move. eurgbp isnt participating, but eurusd is. Patience is a virtue btw ;-). Price action is looking good at 1.503 currently
I had a both 4H and 1H chart confirming GBPUSD turnaround at 1.503.
I must also say that if this too fails I will quit pattern trading forever lol, I have been so disillusioned by it recently…
LOL, any thoughts as to what methods you may look into?
Relax, when a great pattern like this goes south at least we have a support group here. The sharp increase in price upto our point should have probably been an indication to stay out of this one, but we could have been at the top of the swing. Have a beer, enjoy your weekend, and find another pattern just like this to take next week.
Great, it failed. Lost 20 pips.
How many patterns can you guys count that “worked” in the last week? Actually I never had a good week, anyway.
I have checked other sources (than TMB or Pesavento’s book) and saw that the patterns actually had much higher “detail”. TMB’s method merely looks for a AB=CD pattern that coincides with a fib ratio from a more extreme retracement.
We don’t really examine how much XA has retraced (at B) or how much AB has retraced (at C). Even Pesavento’s book (which doesn’t go into more specifics than TMB usually) lists the C retracement as key to determining the D point.
At points B and C we don’t even look for a Fib retracement, actually, which I think should be wrong.
Anyway this week has been incredibly bad for me and I am totally disillusioned by TMB’s method - I believe when TMB was making money from this method, it wasn’t just by the charts he posted to us. He is a full time trader and was probably confirming his entry points by a thousand different methods.
I have a problem drawing Fibonacci lines in Dealbook 360 platform. Does anyone who trades with this methodology use this platform?
Yep, after it had risen up from 1.4850 earlier in the day I was thinking it’d start to exhaust and get turned around but not to be. No worries. Move on to the next.
Around 40-50% where the price actually hit the pattern in roughly the timeframe predicted by drawing the correct ABCD patterns. I had plenty of patterns that never reached formation though also. I had a losing week though this week as I lost discipline by entering a couple of trades that I shouldn’t have.
I usually draw Fib levels for the XA retracement to B and AB to C to see how far price retraced to try and get a better idea of where things might be going. I delete them from any patterns I post as the screen starts looking very cluttered for my tastes.
Probably right. There’s no holy grail to all this. Just have to try and work the probabilities as best we can. If we keep at it and practice and keep sharing stuff we can figure things out over time. I get the impression that a fair percentage of the pattern trading is getting a “feel” for which ones are good patterns for particular pairs.
The .618 AB=CD works very well - I did some studies and if the price bounces very close of the .618, there is a very high chance it will bounce off D if it hits it.
For good symmetry it pretty much needs to hit either the 0.618 or 0.784 marks it seems.
I think maybe part of the problem at the moment is the amount of chop in the markets. Nobody’s sure how the economic recovery is going and investor confidence is extremely twitchy to all sorts of news events. No way to be sure but I suspect that this might have an effect on the percentage of patterns that work out i.e. it could be set to work out and then something comes off the wires and investors overreact.
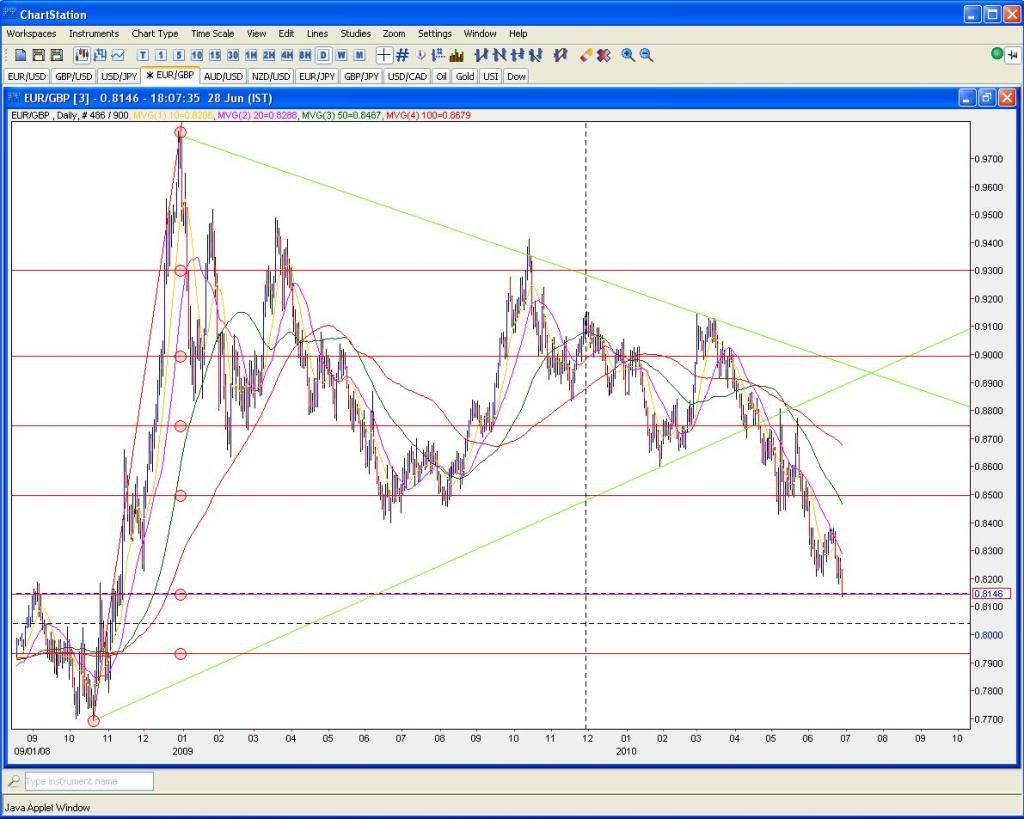
This one is getting pretty close. Price is sitting at 0.8138 currently.
Perhaps another reason for a possible bounce. The 0.786 retracement from the steep rise from 0.77 to 0.98 is at 0.8143. Previous times this year price has hit the Fib levels it’s tended to respond with a decent upward swing over the following days.
Hey guys, sorry for not posting this here sooner, but there’s a AB=CD pattern that hit the D a hour ago. The C isn’t exactly .618 but it is close enough. I took 30 pips and ran but I believe it should get below at least 1.500 levels.

Here’s a potential ABCD in GBP/USD 30 min charts. I’m not overly confident in it as the price only retraced to close to the .500 Fib level which could indicate that the CD leg will be an extension and not the AB=CD as drawn in the pattern here.
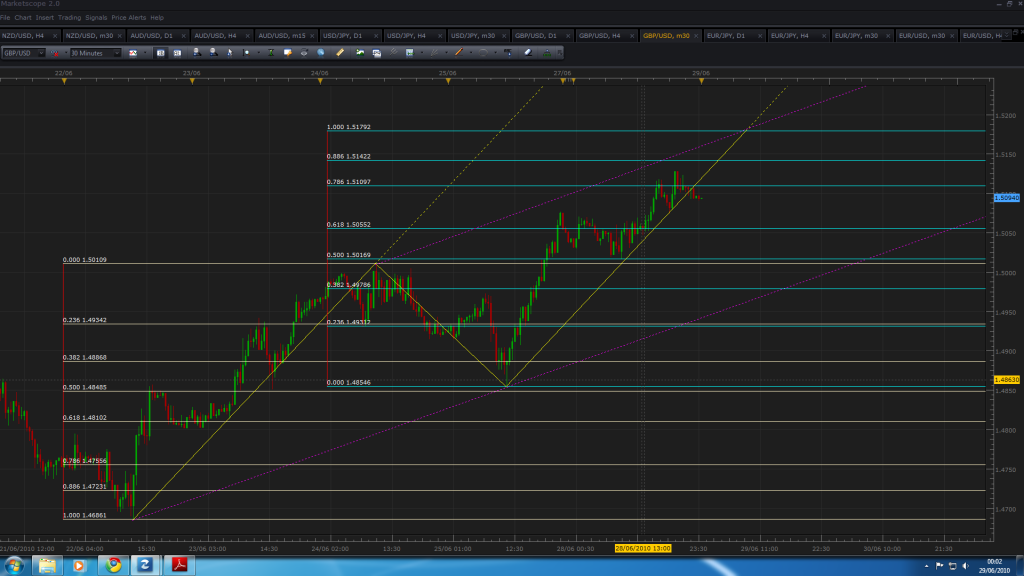
I took it, not overly confident in light of recent gbp strength. Will probably take it early if it gets a decent bounce