It looks like it might bounce. There’s an ascending triangle forming on the 15 min charts which would point to an upward move. Might get enough to jump out with a few pips. Though never entirely confident about those patterns at this time of the day.
Don’t see this pair going anywhere but down over the next while though in general.
I have ordered the book “Trade what you see” I am really interested in the Gartley and butterfly patterns as they look very profitable. I apologize if it has been asked before, but is there a decent MT4 EA or indicator for gartley?
Yep, think that’s the one that Chris posted a while back. The pattern looks a good one. I was in it yesterday but decided to step out for a 10 pip gain last night. So much bad news on the wires about the Euro the past couple of days that I figured I’d see where it went before thinking about re-entering. Prefer to wait for confirmation and take a smaller gain.
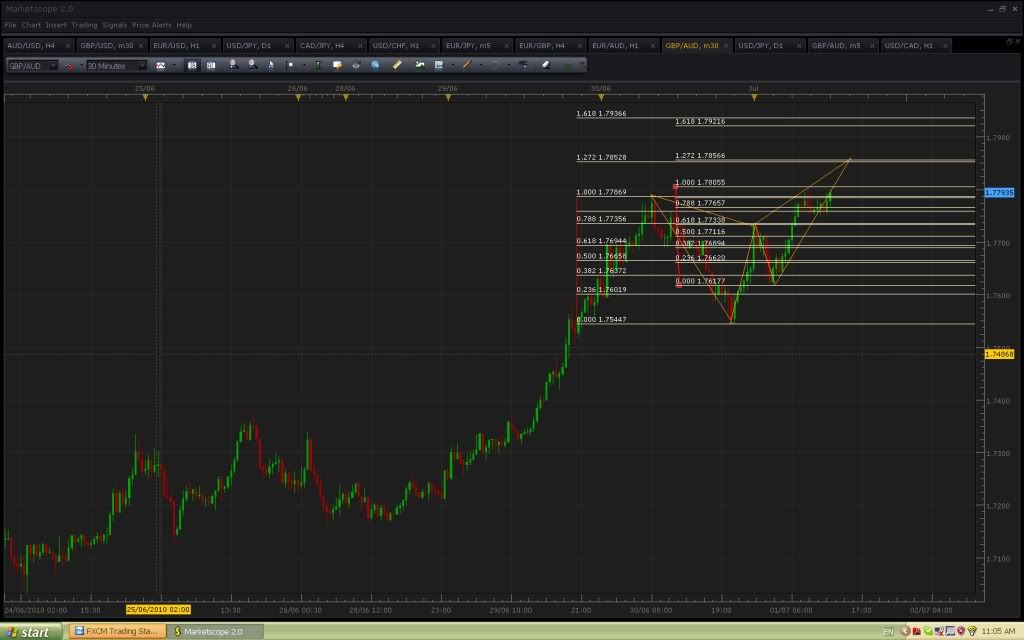
Okay, I think Im finally starting to figure out how to draw these things. Can someone let me know if I did it correctly below? I see that the .618 levels converged almost perfectly but did not form a D there. It looks like the D formed just above at the .764 of A-B. Did I draw something wrong or is it just one of those “no system is perfect” things? Would you still have set a short order at the .618 and let it come back down through it? Thanks for the help.
If anyone wants to look at it, the X point was at 0100 EST on EUR/USD 4 Hour.
The symmetry is off on that one. What you’re ideally looking for is a pattern where the XA and BC lines have symmetry and the AB and CD lines form a AB=CD pattern. Check out the following for a very quick introduction to the basic patterns (listed on the first page of this thread also):
I’m going back to demo trading to experiment with these patterns some more. Want to see what happens if I give trades some more room to breathe with wider stops and let them run for longer. That EUR/GBP was just one example lately where the pattern played out but required sitting through a 50+ pip drawdown for a day or so. The GBP/USD pattern we’d identified needed nearly 100 pips and a couple of days before coming good and would now be +100 pips.
Also going to see what other techniques might be possible to apply to help with entry points / possible pattern success. One thing the last 9 months has taught me is I’ve a ton more to learn.
I waited for EURGBP to do a 20-30pip move upwards before entering - I didn’t enter the trade just because it hit the line. Nothing has to be exact - this I have learned. This also means that we should look for some kind of price action confirmation for our pattern before entering. If I had entered that EURGBP trade blindly, I’d soon have hit my stop loss, but because I waited for it to make an upwards movement, I am at 130 pips now (moved stop loss to 120 pips)
Yeah being able to watch for price confirmation is definitely handy but with the job being so busy lately I think I need to experiment with picking my entry point, giving it some breathing room with the stop level and then leaving it alone to let it play out fully or not as the case may be. I guess this is something like how the contributors on the Babypips main page trade.
Think I need to try and remove myself watching over trades too closely as I have to temptation to meddle with them too much.
I hate when a major news release that tells something unexpected ruins all the patterns etc. Now it will be some time before new patterns involving USD form.
Well unemployment was expected to rise as the Govt. has let go all those census workers so the NFP tomorrow is probably going to be a bad number given that all employment data this week hasn’t been good.
That coupled with manufacturing dropping all over and an air of general pessimism about the economic recovery would normally have people running for the USD but instead it goes the other way.
Gold is dropping sharply which could be a signal of less risk aversion.
Not sure what to make of it all. Probably all leading up to a good opportunity to go short in the near future.