Ello
Here is one on EURJPY 1hr.
If the pattern follows the harmonic structure it should reach its D around 09:00 GMT tomorrow. If there is a daily pivot tomorrow that convergence with the D i would consider this pattern. Anyway here it is 
//Chris
Ello
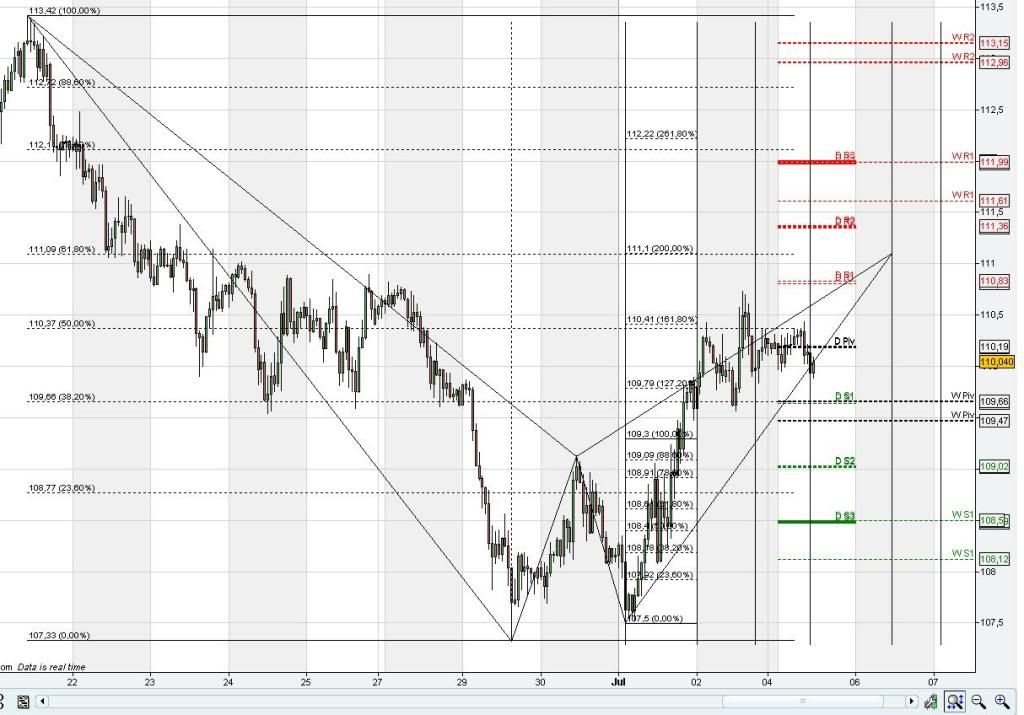
Here is one on EURJPY 1hr.
If the pattern follows the harmonic structure it should reach its D around 09:00 GMT tomorrow. If there is a daily pivot tomorrow that convergence with the D i would consider this pattern. Anyway here it is
//Chris
Thanks Chris. Will be keeping an eye on this one. Looks like it has a bit of work to do to get up there in the timeframe you’re looking at but definitely not impossible for that pair. Guess it’s going to come down to how the Asian session pans out during the night.
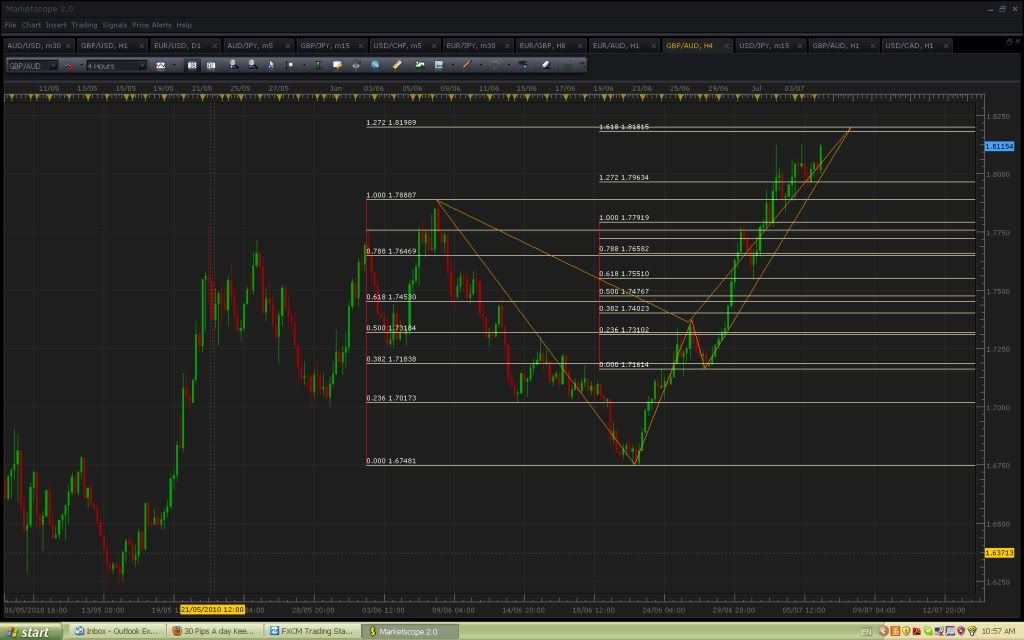
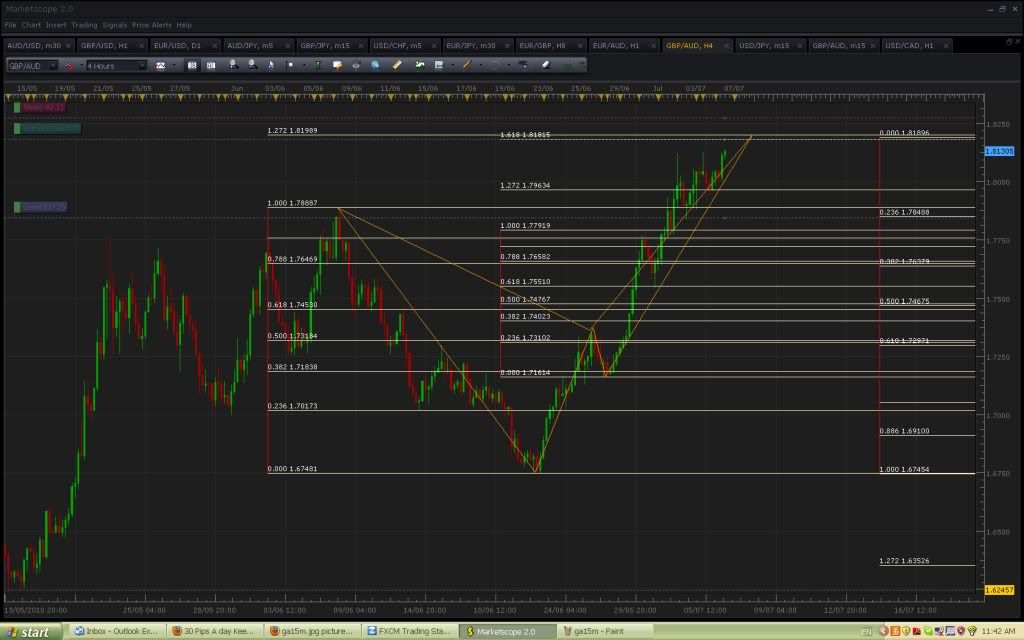
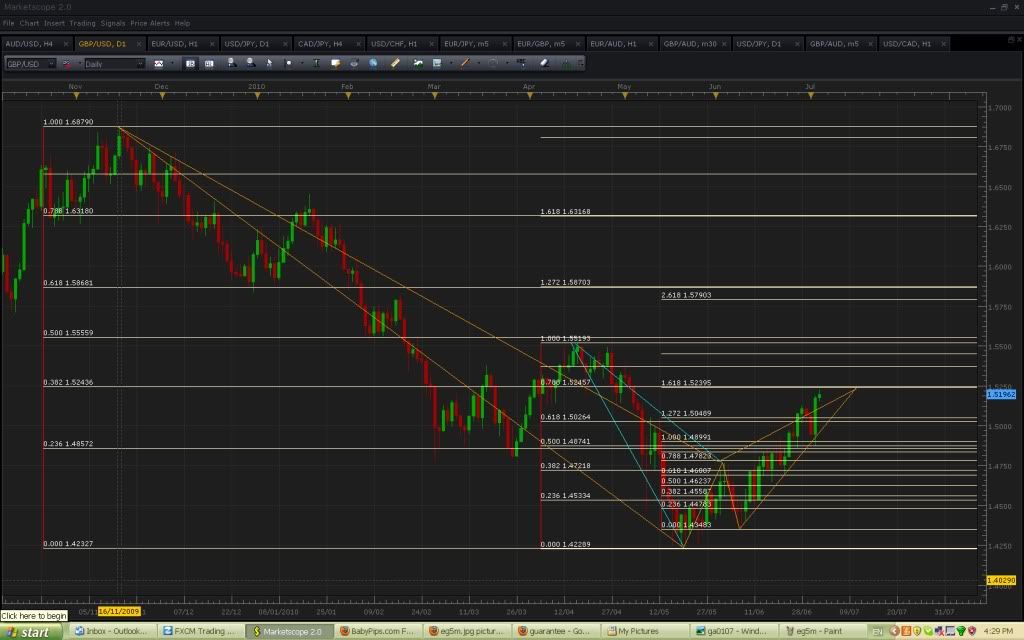
This one not for the faint hearted, particularly with the rba meeting today. but that daily short gu pattern is working well, and can see a vague 5th wave here. 15-20 pip divergence looks bad, but is not a lot for this pair.
Maybe just something to watch and keep an eye on shorter timeframes for cheap entries after 4h D is hit.
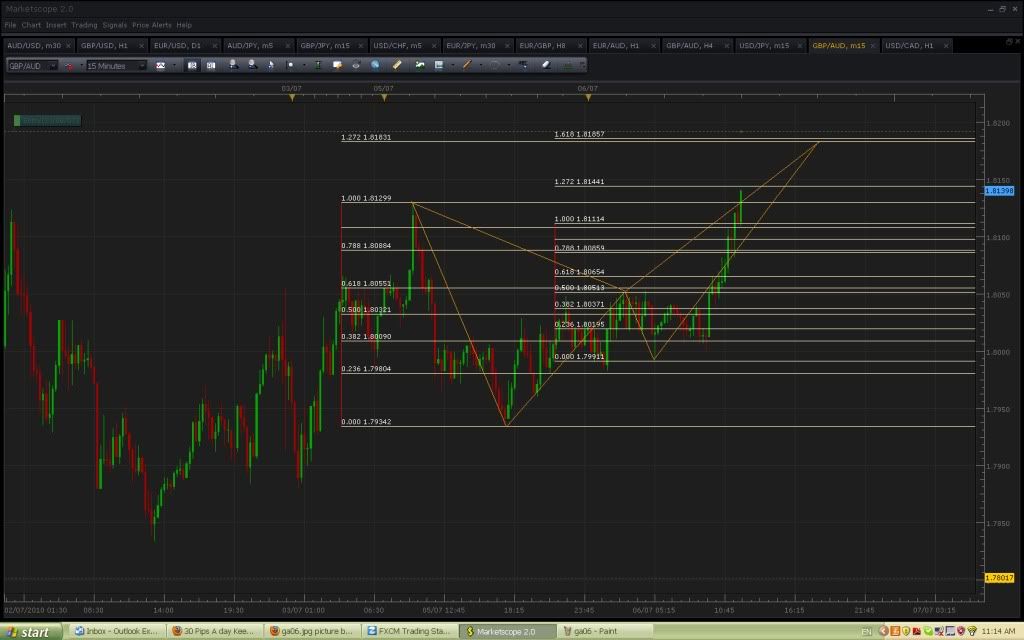
There is also this on the 15m with D at the same level as the 4h (not sure if my B point is correct)
My strategy will be to use the next XA fib from the 15m for my stop (+ about 20 pips for the spread), and the .236AD from the 4h pattern for my limit. RR slightly better than 3.
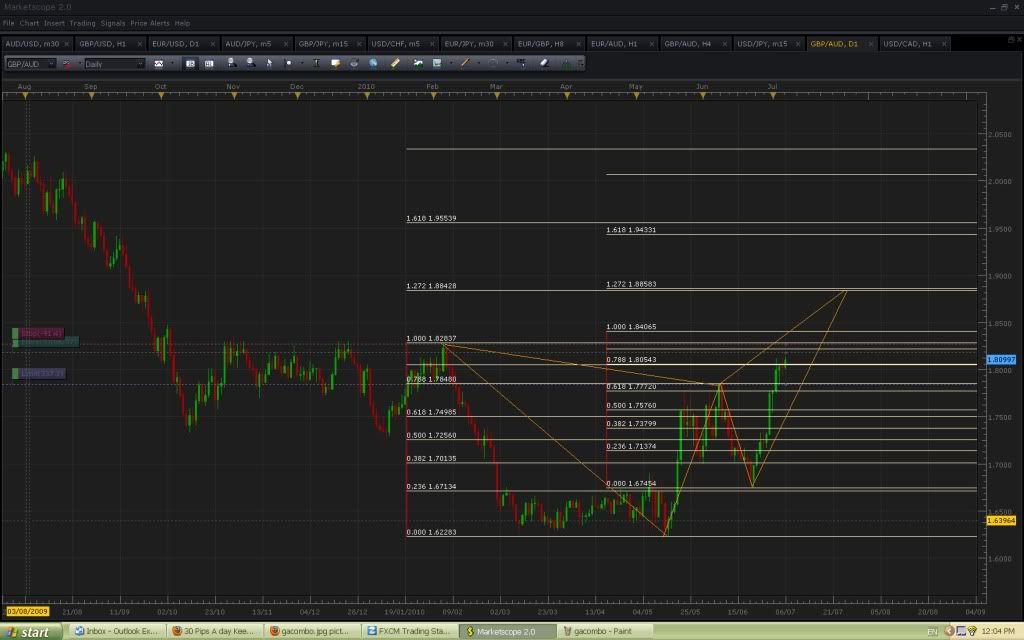
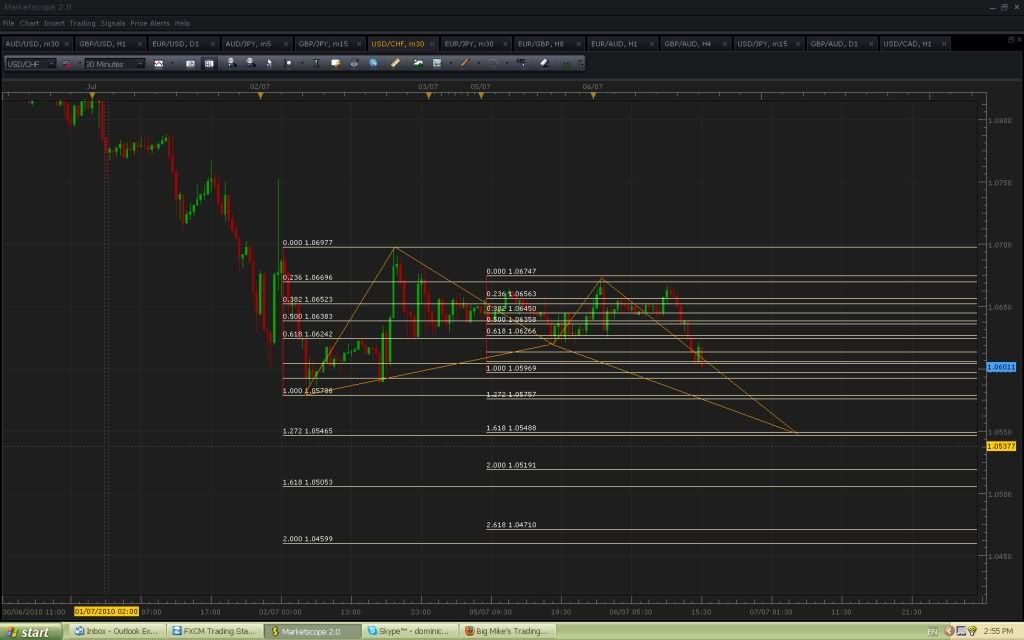
Sorry guys, just one more thing. I just noticed this butterfly on the gbpaud daily chart. I am also trading against the tide by shorting this pair, so I think I will cancel my order from the previous post.
does anyone think this is any good, or am i wrong to even consider catching this knife. also, i dont have a long pattern on a higher timeframe which is another negative.
Modo: That USDCHF pattern doesn’t seem very AB=CD -like to me. I wouldn’t trade it.
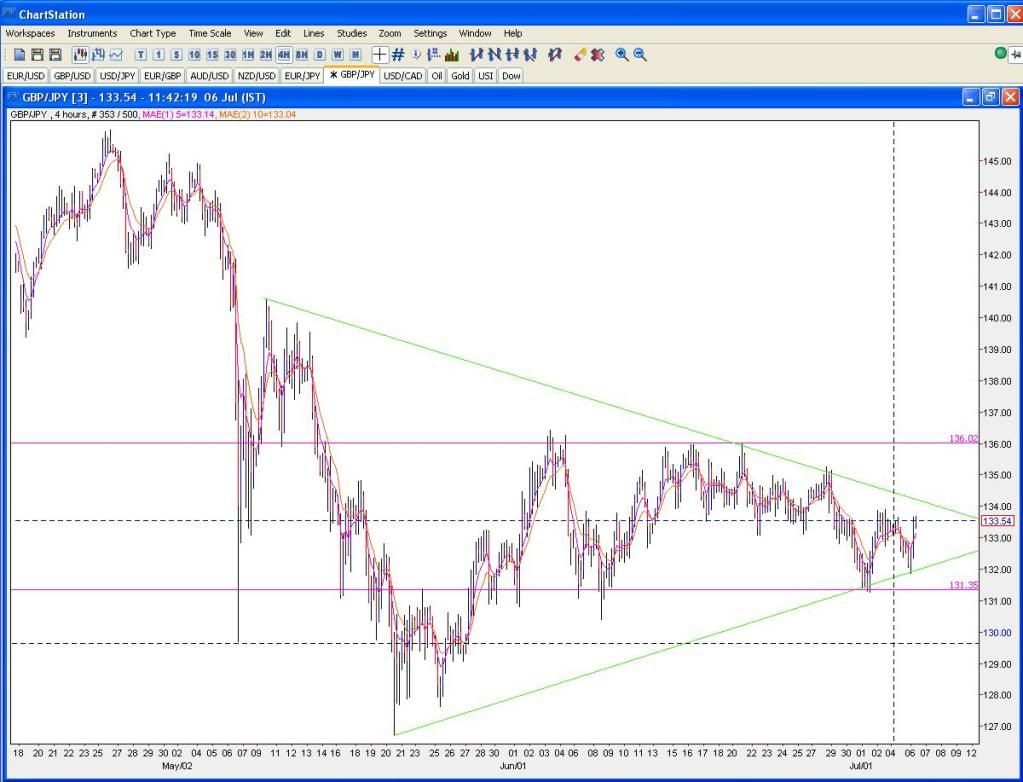
Here’s a 1H GBP/JPY

The important point in this chart is, the B point is essentially a .618 XA retracement, and the C point is a sharp .786 AB retracement. This pattern “should” be solid but price action at D will determine if I enter or not.
The USD/CHF one I’d probably pass on purely from a pattern point of view but there are some other indicators that might lend it some support. The price is hovering at the 0.886 retracement level of the end of March - June rise. This level also currently corresponds with the 200 day MA which has been providing some support since Feb.
Perhaps by waiting a while to see if it is taking a trip upwards you could still catch a decent upswing
Ok guys, thanks for the input. Very good reaction there though, just missed my bid unfortunately. A day of missed opportunities for me.
Looking forward to seeing if this gets up to that price. I’ve been wondering if the GBP/JPY pair is ranging or in a symmetrical triangle. If a triangle then the D from your pattern might provide a good initial TP point.
In my pattern the .786 XA retracement can be a point to enter too - although the convergence is poorer (10 pips) it is on a .786 XA and .618 AB, plus it is pure AB=CD, not the 1.272 AB alternative. We should watch it when it hits around 134.4.
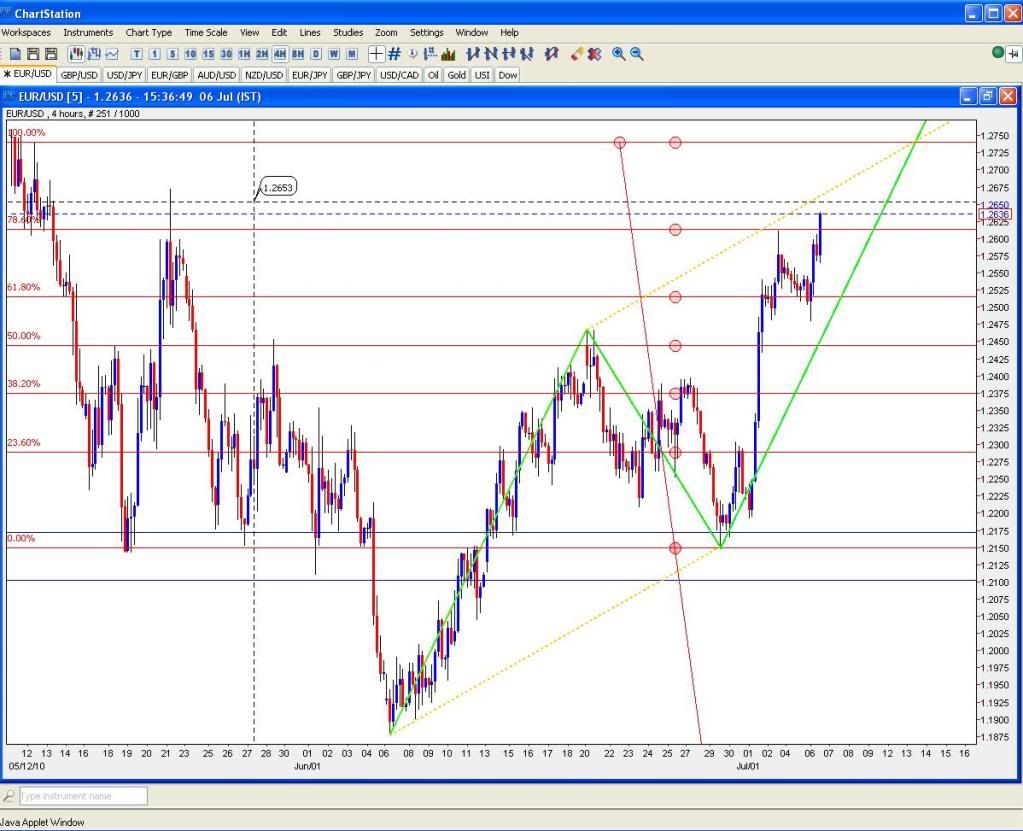
EUR/USD 4 Hour Charts - possible Classic ABCD Pattern
D at ~1.2740. BC is a .500 retracement of AB leading to good symmetry where CD is a 1.000 extension of AB.
[/QUOTE]
be careful Modo - your points aren’t exactly located, and if you draw the fibs from exact points you’ll see that (on the less extreme X) the convergence was much better at the .5XA - 1.272AB point, whereas on your charts the 1.618AB point seems to have better convergence. Also, if you are going for the extreme X fib, there is a more extreme X just before yours.
yeah, valid points, particularly in relation to my more extreme X.
but there does seem to be something at the 1.618 point, when price hits that point it rebounds wildly
exactly, and with swissy also lining up and equities softening i think it’s worth a shot. it’s a considered, patient trade. if it fails (and the swiss) so be it.
Did you notice that at 10 AM the ISM Non-Manufacturing PMI news was released and turned out to be bearish for the USD? At that point the GBP/USD shot upwards, hit 1.618 and bounced back.
Yeah, i’m just looking for one more push thru friday’s highs to take out the shorts. At that point either the floodgates will open and we’ll rally our balls off, or it will be a bull trap and we’ll pop and drop.
I’m off to bed, gnite
A few bad numbers for the US recently have been received as bearish for USD. May be that they have traders seeing no inflationary threat in the US and therefore no pressure on the Fed to hike rates anytime soon. Other currencies such as GBP are feeling inflation and it has traders speculating the BOE might be forced to do something about it but with all the cuts, etc. they’re in the middle of and no growth I don’t see it myself.
I rode Modo’s pattern down for 30 pips.