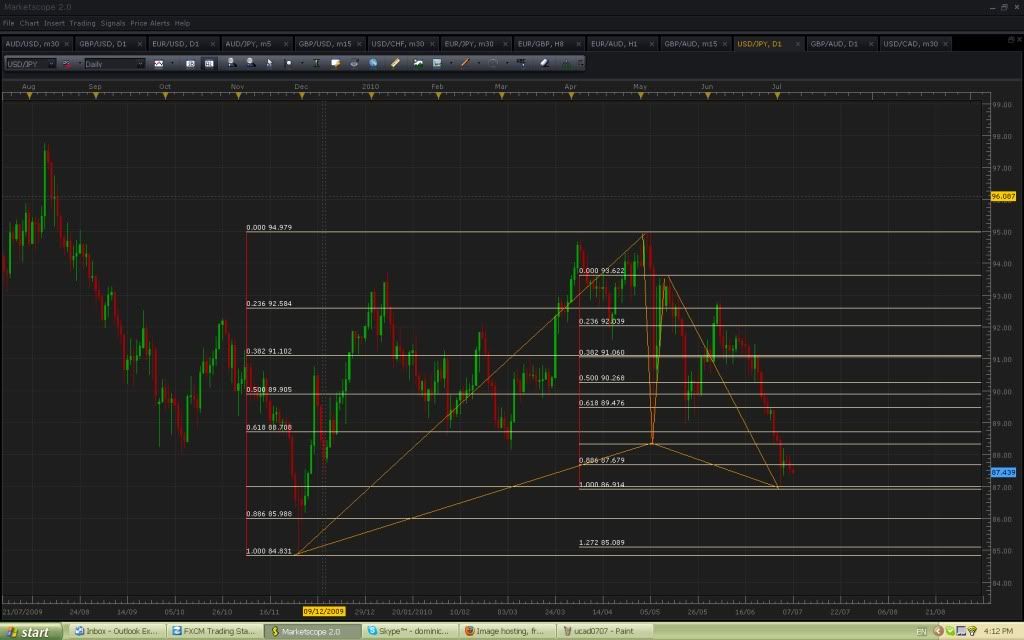
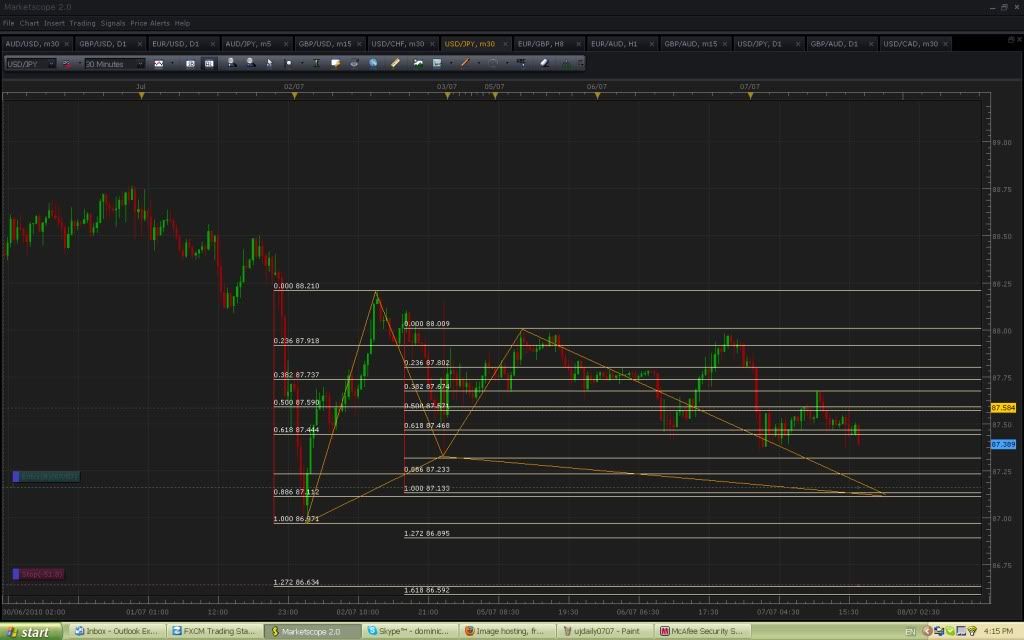
Ok i dont expect you to agree with these patterns, but i’m going in for some uj. I know it’s not pretty but we all know the ugly ones try harder.
Price reacted well on the daily. I’ll have a nibble at the first convergence on the hourly with a small stop, and if that fails try again at the second, then the third haha. I understand these may really blow out in an exhaustion type move, so will only give each level a small stop. wish me luck.
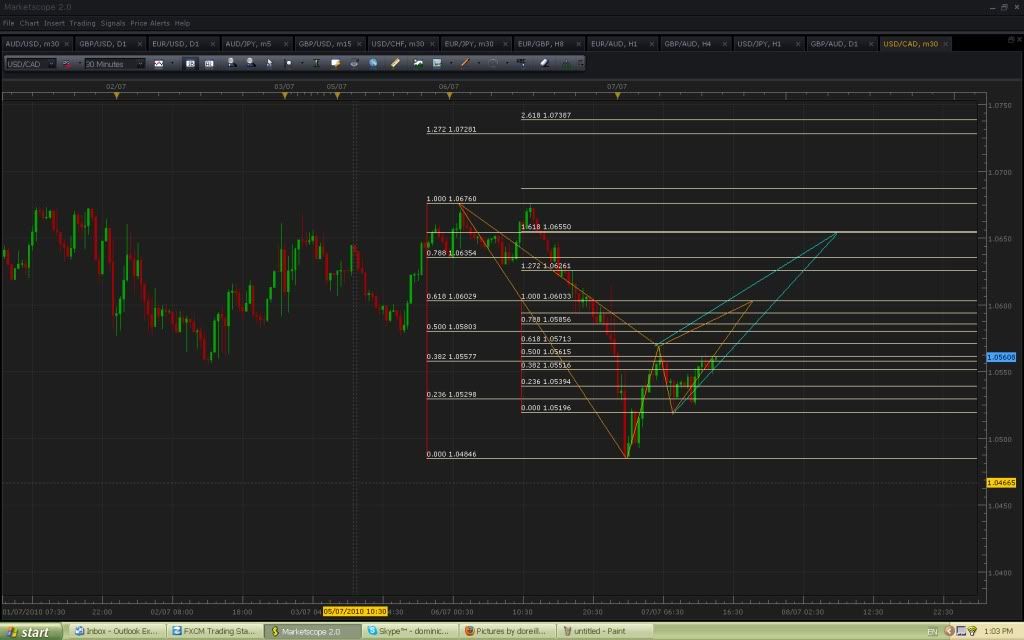
I think that pattern can be very powerful. Why? Because the Fib levels make it the “Perfect Gartley”.
In the Perfect Gartley, the B XA retracement is .618 and the D XA retracement is .786. Also, the CD leg is best at 1.00. Your pattern conforms to all those. If I had seen the pattern earlier I’d definitely give it a go.
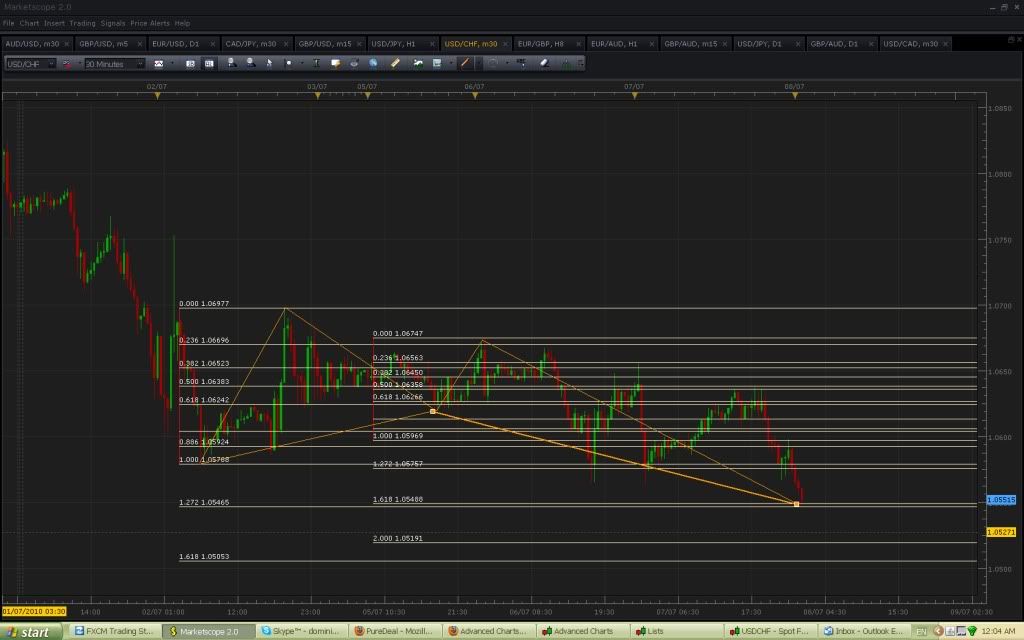
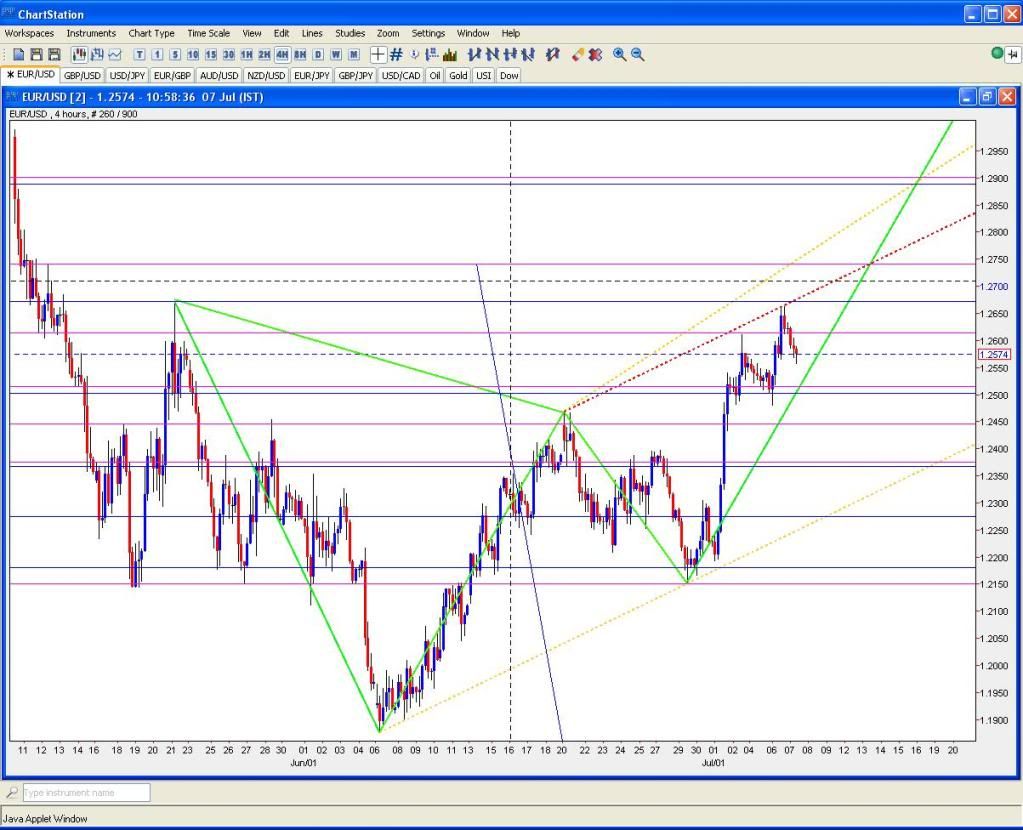
Guys there is an upcoming daily/4h sell pattern in EURUSD. I think you guys can all see the A B C points. The X point can either be taken from the latest swing high (this makes the pattern a 1.272XA Butterfly) or an earlier more extreme point (this makes the pattern a .386XA Gartley).
If taken from the more recent swing (the butterfly) there is convergence around 1.00 AB and it is very close.
If taken from the extreme, the convergence is around 1.27 AB.
However, there seems to be a recent AB=CD pattern at the 1h chart which coincides with the Butterfly. We should keep an eye on this.
I know that TMB said should always go for the more extreme X but according to the Trade What You See book this isn’t an absolute requirement and Gartley / Butterfly patterns can often form on swing high / lows that occur as part of a larger overall pattern. A few of the picture examples they give in the book to demonstrate are patterns are like this.
Also EURGBP: There are a LOT of AB=CD patterns around the area EURGBP is in now. I am sure it will break downwards but I don’t know when - and now I am trading live I want to keep out of it.
Depends on the market i guess, sometimes hard to find any, sometimes too many to follow.
Main thing i find is to work outside in, meaning start with the longer timeframes, then burrow down into the smaller. Thay way you can take little nibbles into larger potential moves.
Most people say not to confuse your timeframes, but I think this refers to people who enter on say a 5 minute chart, then when it starts working pan out to the daily and think it will go forever haha. That’s what I call working inside out and it will get you into trouble as it did with me on the uj two weeks ago.
About 4-5 on average I guess. I do FX spreadbetting as it’s completely tax free in Ireland so typically stick to the more major pairs to avoid brutal spreads.
Probably going to stick in a holding pattern until tomorrow when we’ve got the BOE rate decision and the manufacturing production / industrial production numbers.
They’re not going to change rates yet but the vote and comments by members might have some effect with one member voting for a rate increase already. If the Production increase in line with forecast I think we’ll have the drop then.
I’d jumped the gun a bit by entering at 0.8300 yesterday when it was testing an upper channel which didn’t really hold in the end. Will see how it works out.
Thought it was worth a small go myself as the risk vs. reward is good. I think there’s a fair probability of this pushing upward in a decent way.
Order has been filled so wait and see time now. I’m keeping a tight-ish stop though just in case as if it continues past around here I don’t see another real pause until 1.4030.