yeah, me similar, doesn’t look great, just took a small pos. hopefully it finds a bid to help the uj which is heavy as usual
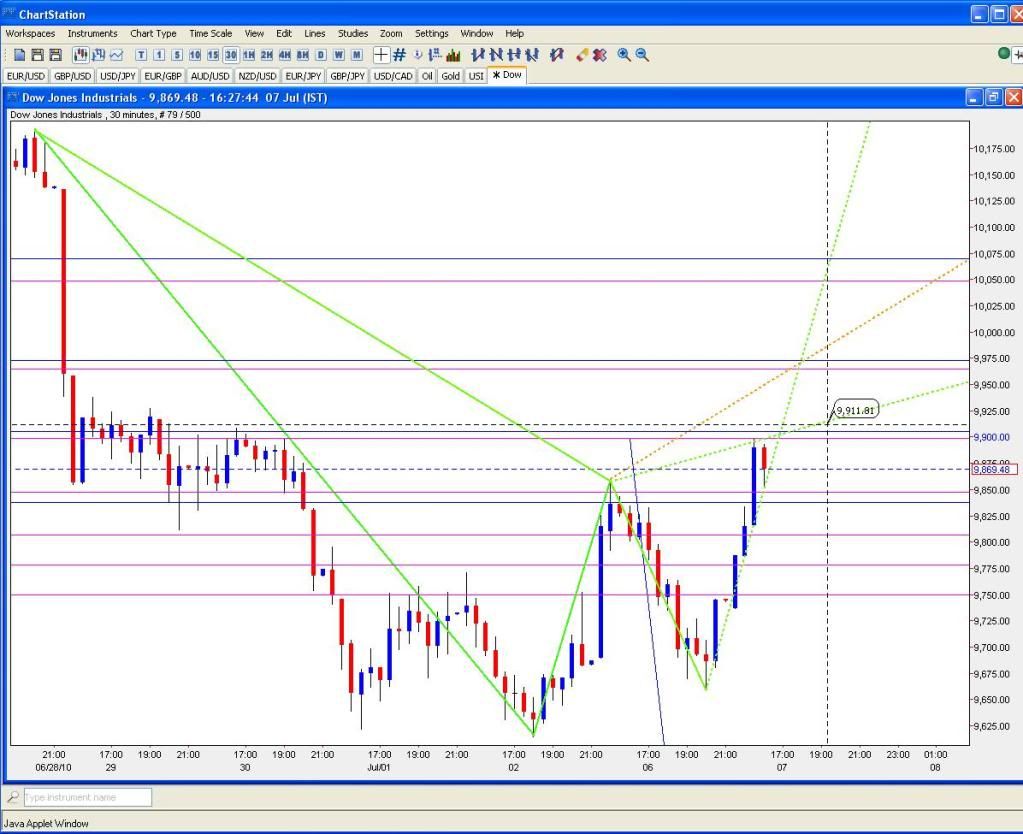
Bearish Gartleys in the Dow - 30 min chart. First worked out for 30 points. Might provide assistance if going for certain USD trades later today.
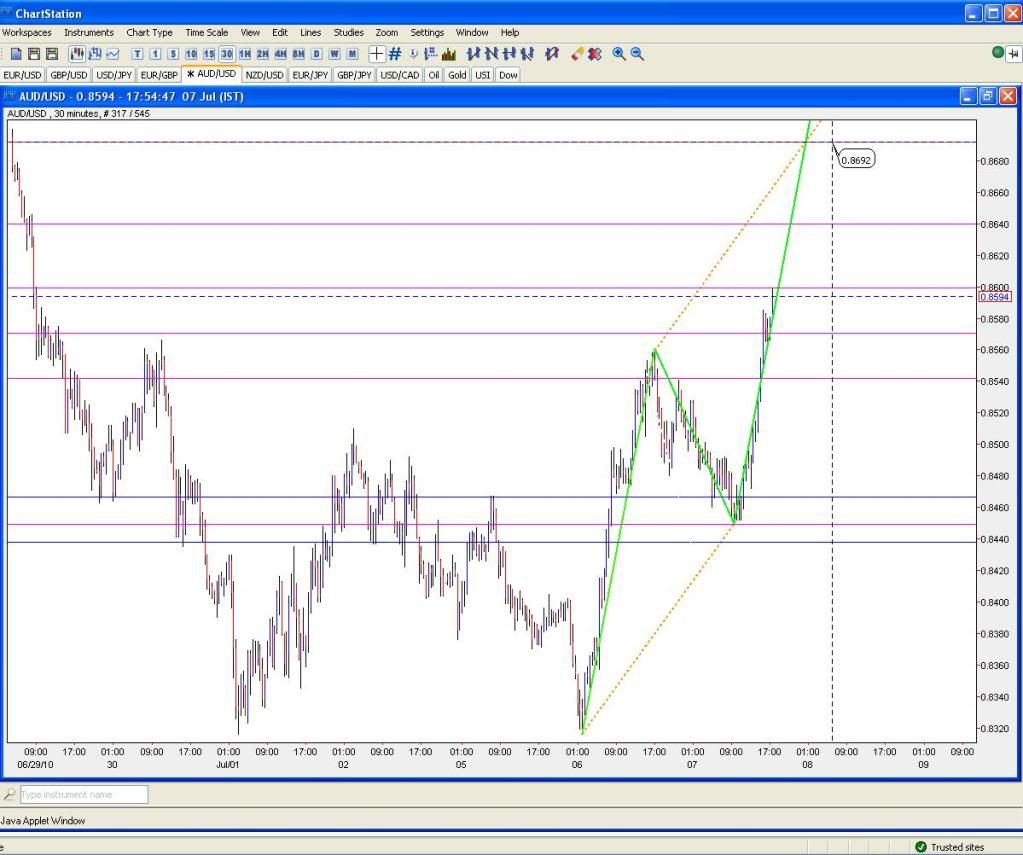
AUD/USD - 30 min charts. Possible ABCD pattern. I’d have my doubts about it getting up there in the timeframe but we’ll see I guess.
Current opportunities:
-
EURGBP has finally began its downward move as expected but I am wary of entering it since it’s very volatile and any stoploss can be hit at any point. Currently it’s on a rising trend (5min/15min charts) so as soon as it hits the top of that trend I think it can be bought.
-
GBPUSD is about to hit the magical 1.618AB number it so quickly reacts to.
-
EURJPY is about to hit a 1H Bearish Gartley point about 111.75. There is also an AB=CD pattern with a D around the 111. Should bring in some pips.
-
USD/CAD: I had shorted this on a 30m chart for a Bearish Gartley but chickened out. If I hadn’t, I was at a 100pip advantage now. Damn.
-
EURUSD: Very close to hitting the D of that 4h chart Butterfly. Even better, there is a very close AB=CD with excellent Fib numbers (0.618) completing at a very close point (Butterfly D: 1.2733 ABCD D: 1.2727).
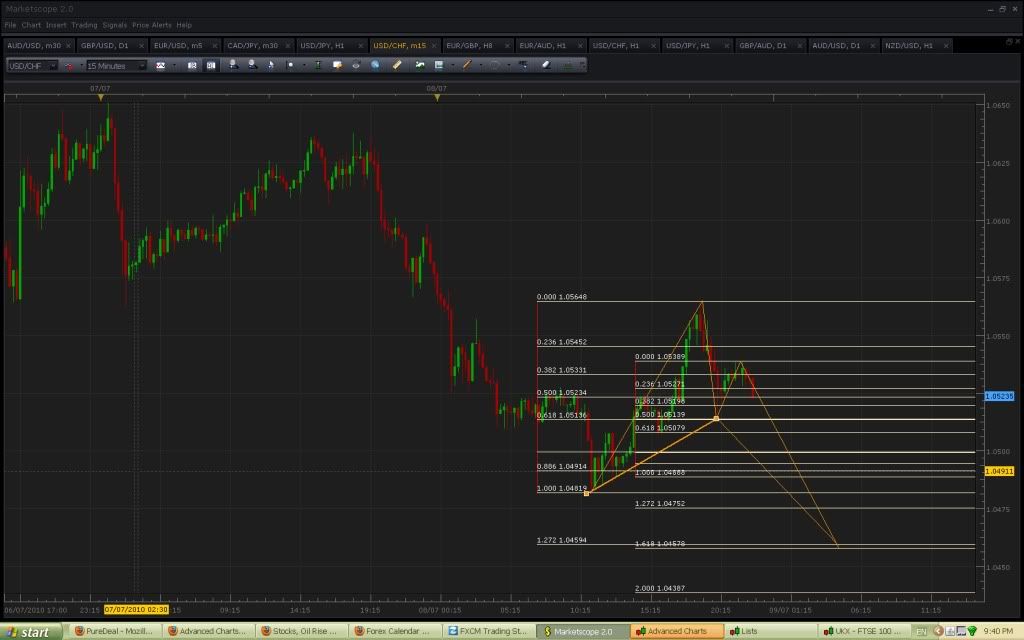
Mmm, doesn’t look too good at the moment. I’m hoping that the sloppy way they’re handling the stress test release in the EU will cause investors to grow more cautious and stop the decline given how dependent Switzerland is on the EU in general. It’s been like a 1200 pip decline since early June too - you’d think there’d be some sort of retracement and things look very oversold. Not going to give up on it just yet.
rubbish isn’t it. my stop at 1.0488, last hope is the jpy data out in 10
A major bearish gartley under USD/JPY 1H. X at 88.75 and D at approximately 88.50. I’m anticipating that the pattern may complete by the end of Asian Session. Should be a good 30 pips.
I reduced my position and moved my stop to 1.0478, so managed to stay in this trade (by a hair), albeit on a smaller position. Stayed withing my money management rules, but moving stops not a good habit to get into.
Man, I just missed some great trades yesterday, but that’s trading I guess, i only just stayed long swissy, so if that works out i’ll stop whinging.
Anyway, I took this short au but got a horrible fill. Was 40 bid and I got filled at 24 on a market order. Should have had a limit entry in place but noticed the pattern very late. Not a lot of fun selling into such strong employment data, but I feel it could be a sell the news situation. On the surface of it you’d think the strong data would be aud positive, but i’m thining they may extrapolate the data to other economies (most notably US), as an indicator that their employment situation will soon follow suit and show strong gains. So good aussie data could in fact be usd positive and hence i’m buying dollars.
The long uj is going ok, my first limit is at 88.88. Maestroshin119, I hope we only find temporary resistance at your level.
Lost 20 pips to a 1H EUR/JPY pattern - but I practically asked for it. I set my entry and stop and went to bed; meanwhile as the pattern was about to complete the 3 bad JPY news came and EUR/JPY broke through the line. And I knew that some JPY news was coming… trade and learn, I guess.
Probably a mistake, but I had a bad feeling so closed my long uchf trades. Made a few bucks so can’t complain. No doubt it will scream higher now, but if so I can always buy the bullback. Greed and fear of missing out made it hard to close, but I wasn’t happy with the price action.
This pattern is probably too early to call, but I take it if it gets there.
Also put the short aussie 4h back on at better fill .8755 and with the correct stop .8796. Hopefully the jobs data out of the states surprises to the upside.
Good luck today.
Thanks PipBandit, this looks like a nice bat.
I spotted that bat too but I have reservations about the .886 fib.
There is a USD/CAD bullish pattern confirmed with multiple X’s. It’s very close.
.886 XA is the correct place for a bat to form it’s D
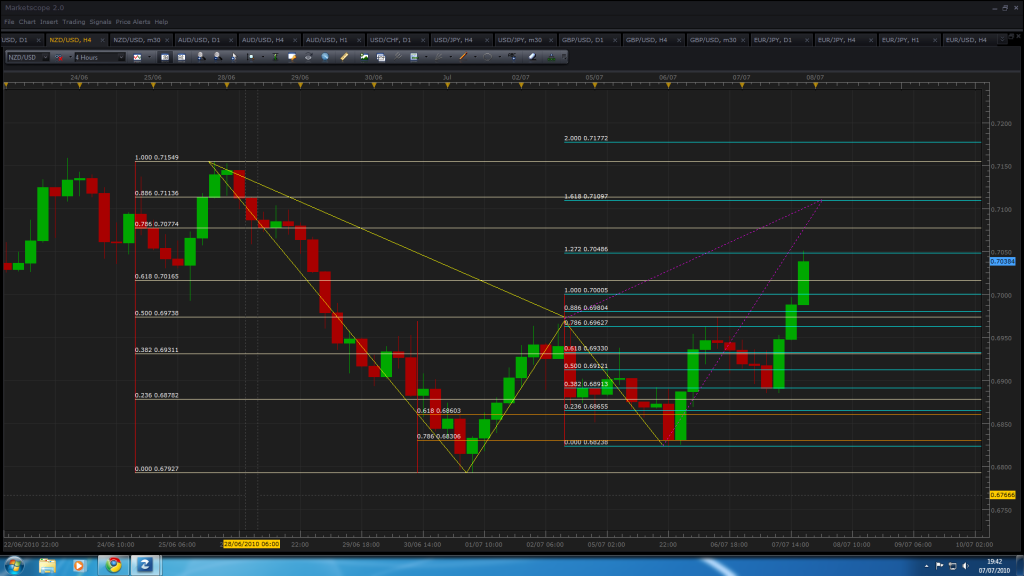
that kiwi could hit at a really nice time of day too. covered my short aussie for a 10 pip los…meh. will re-enter around the figure.
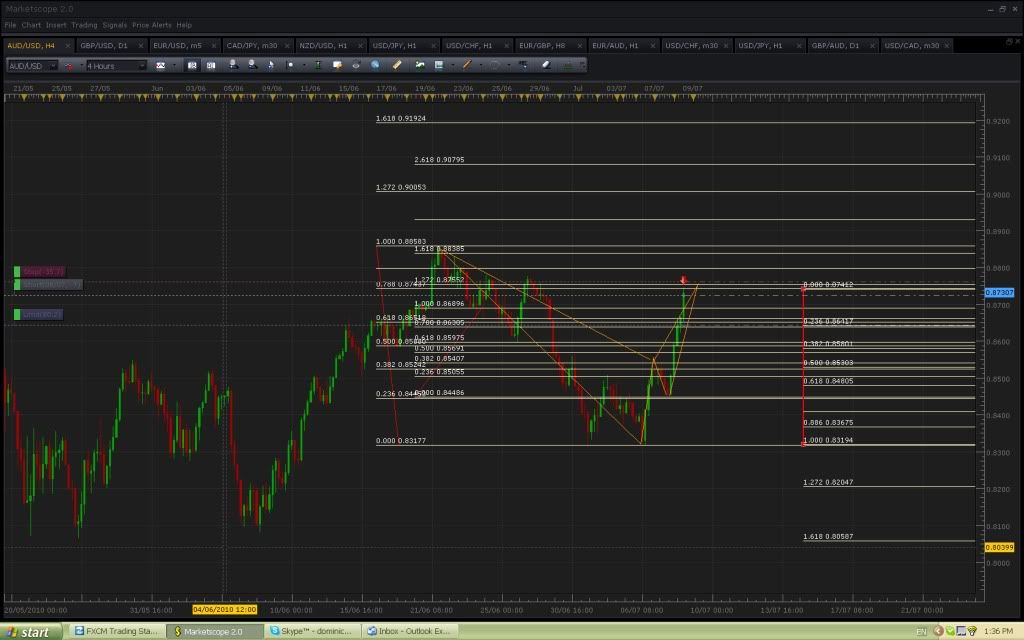
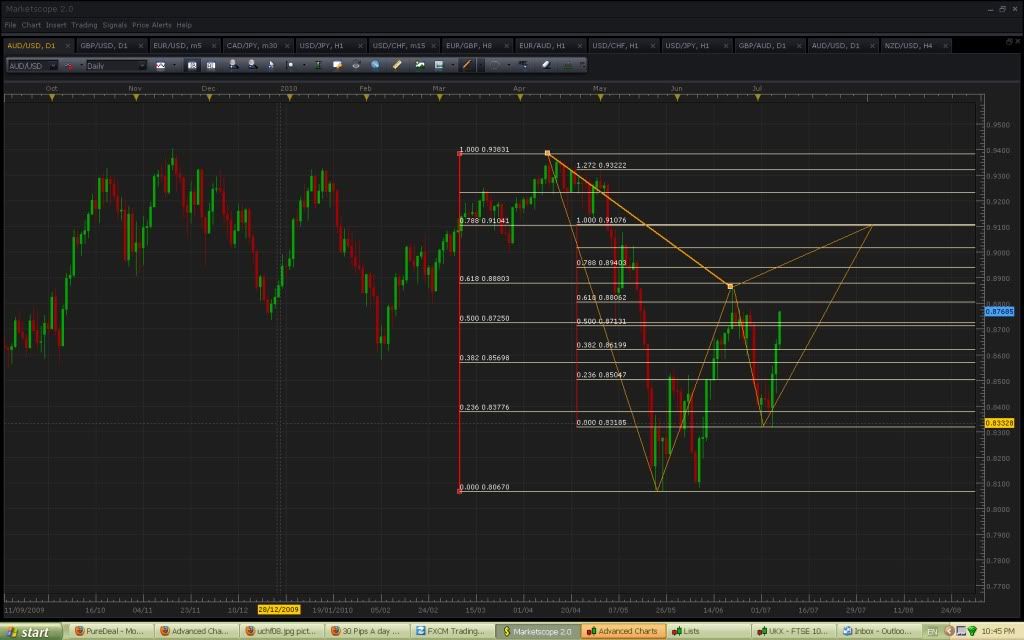
Annihiliator, you might like this one on the aussie daily. Seems to conform to the gartley fib propotions.
That pattern is an ART!!
but no, seriously, that is a very solid pattern. .786 XA ret, 1.00AB projection. It looks awesome - if it reaches that level I would trade that. Needs 300 pips, though.
haha, you crack me up. one for the whiteboard my friend.
gee there are a lot of patterns about to hit…
USD/CAD has JUST hit the bullish pattern I was talking about. I am hopeful.