Missed my entry by… less than 1 pip. The price bounced violently and made a 200 pips upward move.
Same for the EURGBP, missed by 2 pips, bounced and made 100 pip upward move.
Missed my entry by… less than 1 pip. The price bounced violently and made a 200 pips upward move.
Same for the EURGBP, missed by 2 pips, bounced and made 100 pip upward move.
Ouch, killer. In [I]Trade What You See[/I], they talk about padding your entry by a few points to ensure you are entered, especially if you expect the D point to be hit while you are asleep or away from your monitor. I missed 2 last week worth 100 total. One by 3 pips and the other by 2.
Brilliant, well done. This was a really nice trade that I had on my radar, but could not participate in becuae I had already dusted my 0.5% daily allowance on rubbish 5 min patterns during horrible market hours. My idea was correct, but the execution was poor. Impatience and fear of missing out cost me what should have been a very good day.
Congratulations mate. Don’t let the fact that you just missed these trades fool you. Actually, the fact that you just missed them idicates to me that you are trading really well. You are obviously finding great areas and showing excellent discipline to hold firm to your entry level, which will pay off in the long run.
Just be patient now. Dont rush the next trade. Hold your nerve and wait for the next high quaility setup. You may also want to consider relaxing your enty rules SLIGHTLY, eg a 5 pip shave to account for spread etc.
this is what i do when i have a multiple convergence lvls…i know its a crazy move but it worked every time so far…when i spot multiple converg. lvls and i cant see other support or resistance lvls or any other signs that THIS is the lvl the price will reverse,i jump on the first convergence lvl with half position and i stay untill im -20 to -30 pips/depends on TF/…if it keeps going against me and coming to the seccond convergence lvl i jump on the seccond one with double the position size and ride it against me for -20-30 to the third convergence lvl and i double the position again …and this is going on untill the price reverses and still with +30 pips you are clear from loses and made it with some profits…it needs time infront of the monitor but it works…guys tell me what you think
Here is some bearish GBPUSD for you guys, I know the GBP is very strong at the moment but this pattern seems great, idk… Both a Daily and a Hourly pattern pointing at the same spot


and if price doesn’t reverse…you blow up or do irreparable damage to your account. no offence speculant, but i think it’is a really bad idea.
in fact i think you want to do the complete opposite. cut positions that aren’t working, and add to those that are.
it comes down to accepting when you are wrong, and knowing when you are right (not easy either). good traders know when they are right and go for the jugular.
when the wind is at your back, raise the spinnaker.
[QUOTE=modo;206107]and if price doesn’t reverse…you blow up or do irreparable damage to your account. no offence speculant, but i think it’is a really bad idea.
None taken Modo,it was just something i tried on a demo for a week…its some sort of a roulette gambling tactical aproach and at the end you end up loosing, because your account needs to be endless for this to work…
btw, how you guys upload full img to the thread…i got a warning message form the forum moderator that i cant upload links…cheers
Open up a Photobucket account. Make a screenshot of the image and paste it into ms paint or whatever. Save it as a jpeg and upload to Photobucket.
Then click on the IMG Code (outlined in red below) to copy the link and then paste it into the post. Or you can just copy the url and place the tags around it yourself. This links the Photobucket jpeg to the post and displays it as a full image.
!!!T H A N K S!!! PIPBANDIT,got it!
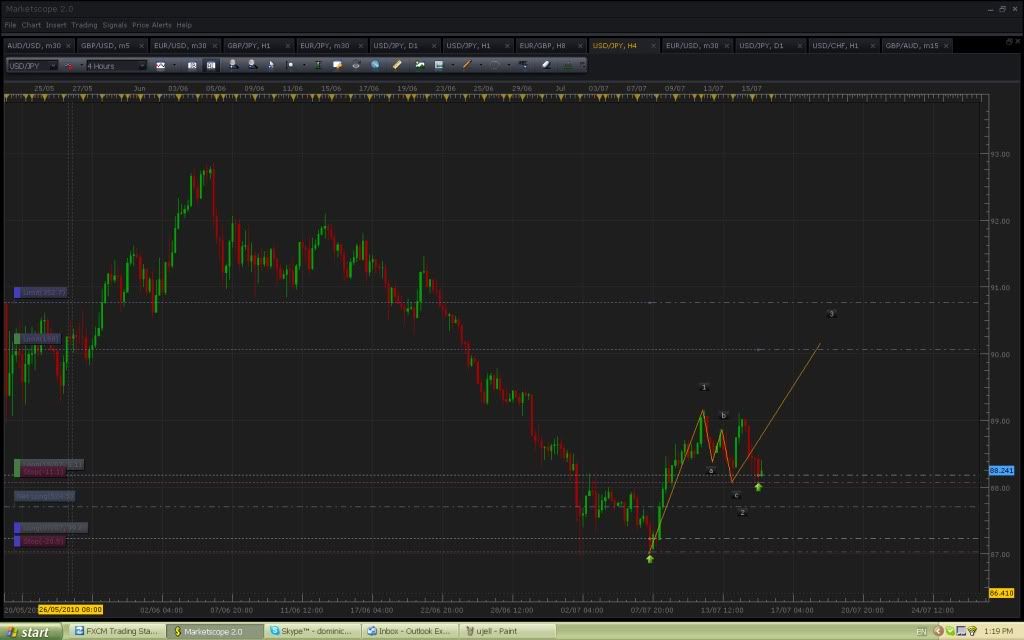
A follow up to the USD/JPY already posted up by Speculant. Two potential patterns with an AB=CD completing at just under 88.00 and a Bullish Gartley with ~2 pip convergence at ~87.26.
Ah decisions, decisions. I am unable to trade at all now as I am upgrading my micro account to a standard account and cant have any open trades until the switch goes through. I guess I would just watch the PA as it crosses the AB=CD and decide if I would take the first or second.
hi all! im waiting on this pattern and STILL looks valid to me.the different X locations give me the same convergence and is pretty accurate too for all 3 X’s…there are 19-20 pips from last high to 1,272 convergence lvl so i think it is not a MISS…I think the price didnt have enought juice durring volatile hours and now is floating waiting for some volume to kick in/maybe in asia session/…it was my first analysis and am a bit nervous dumping my thoughts…if you have the same setup please comment…cheeeers

Uploaded with ImageShack.us
Speculant: If you construct your B and C a little bit to the right of your point, we have another pattern:

Around here it’s usually told not to trade 1.00 XA trades (like yours) because they are “rare” patterns, but there is also the fact that your 1.00 AB reacted very well. On my chart, the price tanked before it reached 1.00AB, and when it finally reached my 1.00AB it still continued to make a 40pip upward move before falling down.
All in all I can’t make a decision between your pattern and mine.
hi… this is what i get when play with the fibs a bit… the blue fib is C/A1 to B1 moved to C1 and we get ab=cd inside the CD led from the pattern i and Annihilator posted before…still, alot of movement till then …

Uploaded with ImageShack.us
Yes I saw that alternative ABCD too and it coincides with the 1.272 line. I think I’ll pass on 1.00 and wait for 1.272.
I wanted to butt-in and provide some of my ideas on the pattern. Again, I’m still learning all these patterns. I don’t know, Speculant. To me I think the first pattern has reached its D and, from my previous experiences, I wouldn’t trade under a pattern that has been completed already (got burned several times). Seems like your second D may provide you a new opportunity, but then again this is a 4H chart and God knows when/if that D will be reached.
You may already have noticed, but seems like the price has been moving within a rising channel (when you draw a trend line from A to C1 and another one from B to B1). If the price bounces off, perhaps that can give you some confirmation as to whether the patterns will be valid for trading.
I’d expect them both to work out if price action can force it’s way up there over the next few days with the 1.000 providing a short term resistance and the 1.272 offering some really good resistance. The 1.272 level also coincides with the 0.382 Fib from the decline from 127.904 at the start of April - sits at 115.171.
if these yen pairs break out i’m not sure you want to be fading them. just my 2 cents.