Hi all…just wanted to share 2 more patterns that are forming just now…
ImageShack - usdjpy.png img196.imageshack.us/img196/1134/usdjpy.png
ImageShack - eurusdb.png img651.imageshack.us/img651/467/eurusdb.png
Hi all…just wanted to share 2 more patterns that are forming just now…
ImageShack - usdjpy.png img196.imageshack.us/img196/1134/usdjpy.png
ImageShack - eurusdb.png img651.imageshack.us/img651/467/eurusdb.png
Yeah I’d posted the USD/JPY one earlier. Not sure it’d be wise to take it with the way price action has been going. Dropping like a stone. Could be worth a speculative punt with a tight-ish stop.
[QUOTE=speculant;206256]hi… this is what i get when play with the fibs a bit… the blue fib is C/A1 to B1 moved to C1 and we get ab=cd inside the CD led from the pattern i and Annihilator posted before…still, alot of movement till then …
ImageShack - 75886650.png img231.imageshack.us/img231/4474/75886650.png
it worked great/just touched the convergence area and droped down/ … i took my share and ran
The dollar is incredibly weak…
Yeah, surely was today.
Nothing really catching my eye to trade now either except maybe the USD/JPY long which I’m thinking could be worth a small position. The current level has been an effective support in Dec '08, Jan '09 and now all through July. The 87.26 level in the Bullish Gartley has held a couple of times today so think I’ll enter a small go at it.
Why was the Speculant guy banned ?
I think he was warned about posting links and the images that he then put up still had links at the bottom of them. Probably unintentional mistake as he’d asked about how to post images like we do. He should’ve used Photobucket maybe.
oh, so it must be a temporary ban then.
I’d assume so. Seemed an unintentional mistake to me.
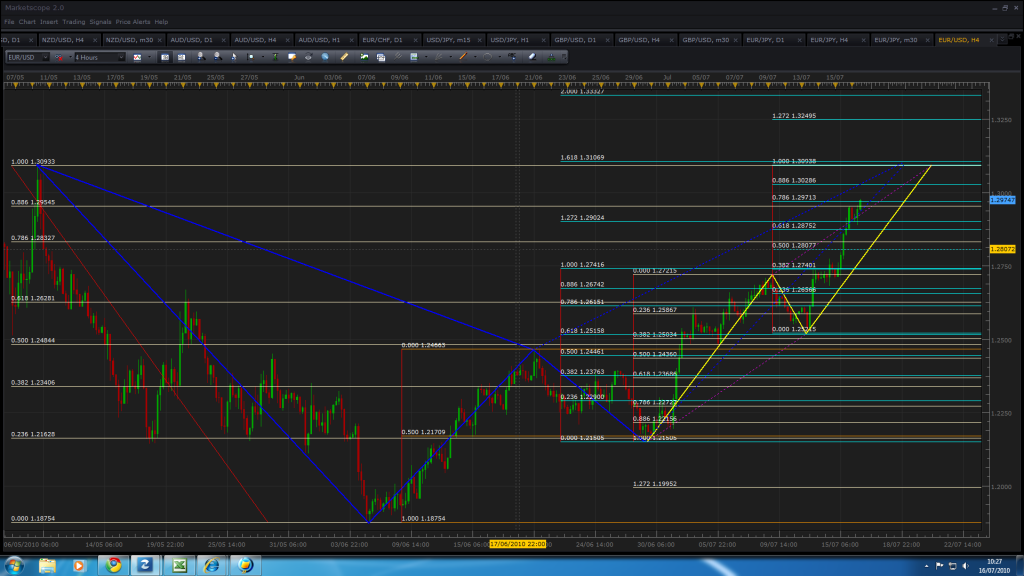
Anyway, EUR/USD 4 Hour Charts - 2 potential patterns completing very close to each other. A bearish Gartley and AB=CD seem to point to the 1.31 area. I know the X isn’t an extreme but it looks like it’s in play with a 50% retracement on AB and then another 50% retracement for BC.
If you make your X the most extreme point recently (1.5134) you’ll see that your D also sort of converges with the .382 retracement. Not the best convergence, 30 pips but when you look at the range of the XA (3100 pips) it should count.
Yep, true. That’s ok convergence for the range we’re looking at. All in all it looks like a good congestion of resistance levels. If price does manage to get up there I’d give it a go. Could be a decent turnaround as this rally in the Euro looks overdone to me.
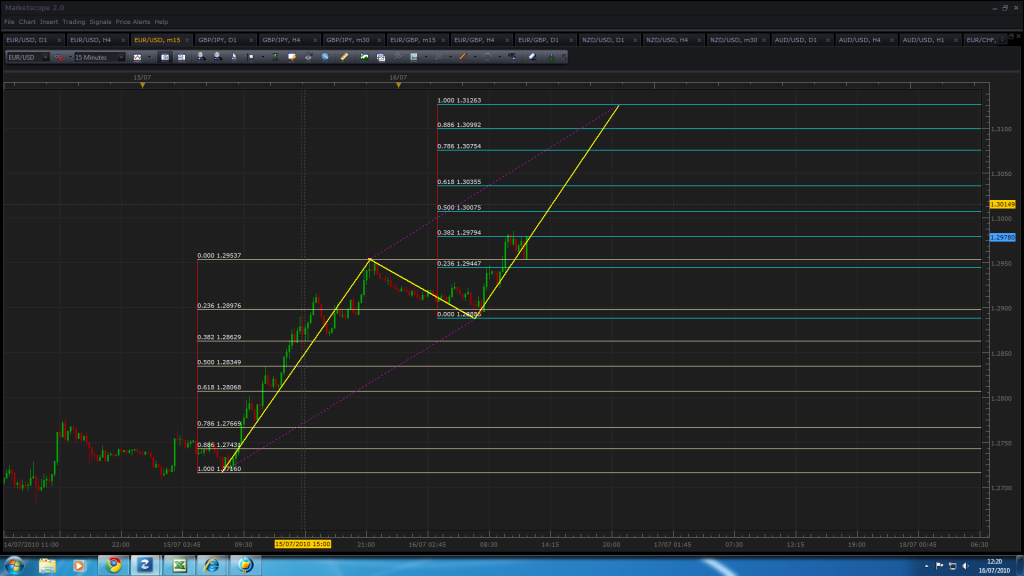
EUR/USD 15 min charts - AB=CD where the D forms at just a few pips higher than the .382 Fib retrace level on the Daily 1.51431 - 1.18754 decline.
Guys a questions totally of topic.
I will soon start studying on the university, so i will then be abel to use forex brokers with a downloaded trading software, atm i use a java based at work.
Any thoughts about wich tradingsoftware is the best for this sort of trading?
The thing i need is pivot points and of crouse the fib drawing tools.
What charting software do you guys use? 
//Chris
Myself, Modo and Annihilator all use the FXCM package to post up our screenshots. Don’t know what they actually use to trade but as far as just for charting I think it’d have everything you need
Thx man, ill try it out
//Chris
Chris, I would check out their fib time extension capabilities. Might not be sufficient for your purposes.
USD/CHF 30 minute gartley. Also lines up nicely on the 1H chart and the D point is right at a previous support turned possible resistance. The long term (4H) trend is bearish as well.
How to you guys get the whole screen shot to come up? If you look at my posts all you get is the chart? I use the save chart as image function on TS II. But I like the whole thing better.
Disregard, got it.
Hey guys, here is a 60min Aussie chart. Sorry for the mess with fibs but I think you get the idea. I like this pattern because the fib points are exact.
The AB (and CD) range is very small so a target profit higher than 30 pips isn’t very realistic here. There are major Aussie news to be released but there’s still 10 hours until that.

