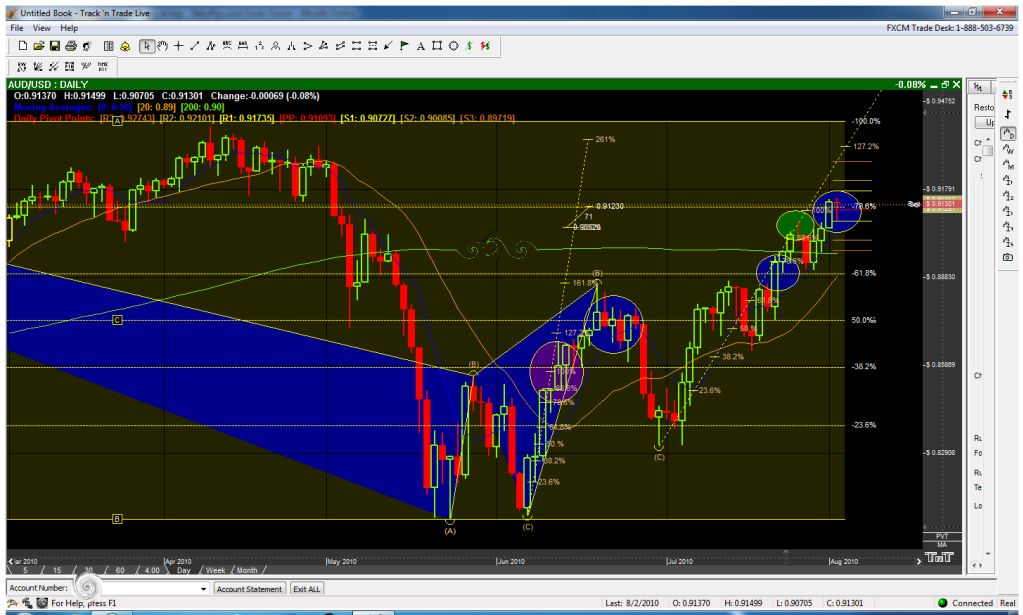
Here is the daily AUD/USD to go along with your 30 min.

TMB says this is not a pattern
It has always been the first swing, using the second to see if their is multiple convergence in some cases or if the 261% of CD on the first swing had already been broken. It is clearly written in the Trade what you see book I’ve recommended in the past and I am certain it is in my Rules of The Trade PDF as well. In the majority of cases, the second swing is first swing of a higher time frame.
*Note in rare cases, you’re C point (end of first swing) will be at the same exact level of your A point. As long as C >= A and C < B then the swing is valid and the BC point must be used. If symmetry is not found such as the case of the AUD/USD Daily, then you must move to a higher or lower time frame and find the correct CD point. If all else fails, simply move on to the next pair or one within closest proximity such as the AUD/JPY or the NZD/USD, etc.
But regardless of whether it’s the first swing or the second, there is an AB=CD pattern with a D right at a .786 retracement point. Doesn’t that still make that point a good candidate for a bounce?
First of all the win % chance of a AB=CD to my recollection is that of 40% and that of a Gartley/Butterfly pattern is at 70%. The advantage behind the method I have shared with you all is that it raises your 70% win chance to that of a range closer to 85-90%. In other words your only downfall should be the psychological factor (Discipline).
Now Lets analyze the AUD/USD and find reason why it has been behaving the way it has for the past year or so and Also why its currently reacting the way it is. As I had stated previously, when things do not make sense in a certain time frame then you must move towards another. In our case we will move on from the daily and then analyze the weekly to see if things are a bit clearer their.
Bellow we have the AUD/USD Daily chart open and “off the bat” you can see that a pattern was formed where 100% CD converged with the .382 of XA. Unfortunately though this price area was a fake out (close above the convergence point Purple). Their was also multiple convergence points in this chart (First 2 Blue circles) and in each point price closed above the convergence and moved on to the next fib level. Again, the same thing is happening today where the .786 of the first swing has ‘faint’ convergence with the 200 % CD (A difference of 76 pips). In addition, when using the second swing their is also a perfect 100% AB = CD. The problem here is though that as soon as these convergence point complete, price yet again fakes out and closes above the resistance area. There is a reason why price is breaking through these MAJOR points and a weekly close above them is extremely significant. As you can see from past history price will more then likely move up to the next level.
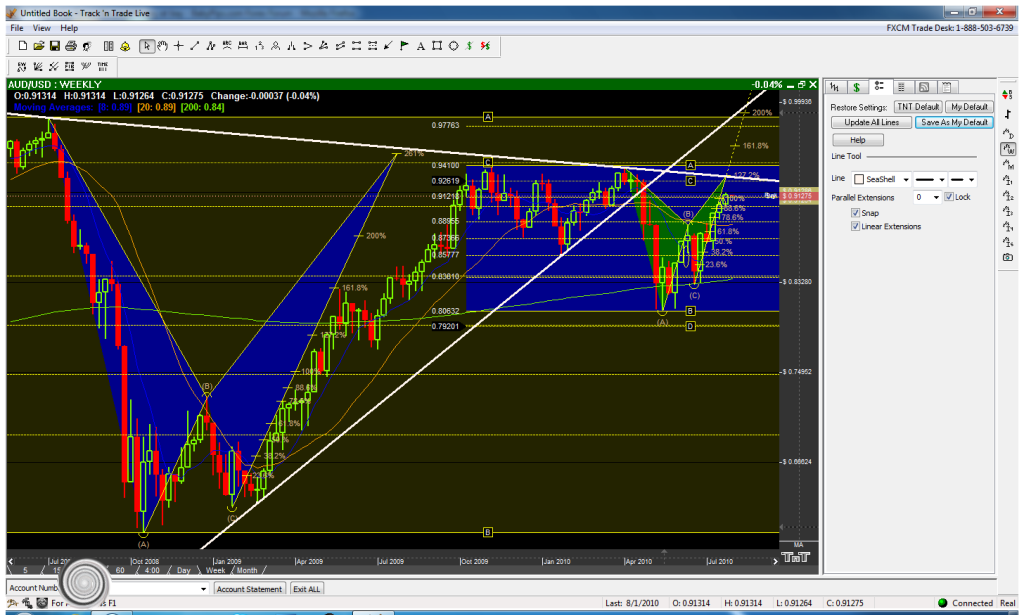
Now, lets look in deeper and see what is really happening. Bellow you will notice that the White lines I have drawn form what looks like a HUGE ascending triangle which broke on the 25 of April and closed 340 pips outside. Not only is this the break of an ascending triangle but it’s also the break of a flag formed after price touched the .886 of XA and missed the 261% CD shortly above (Blue Pattern). Now the break of the flag along with the triangle indicates that the sellers where finally comfortable shorting the pair giving weight to the pattern, the result is a 1100 pip drop which stops and forms triple bottoms exactly on the .382 of AD. This strongly indicates that a retest of the highs is to come and that the 261% CD that priced missed will be the target.
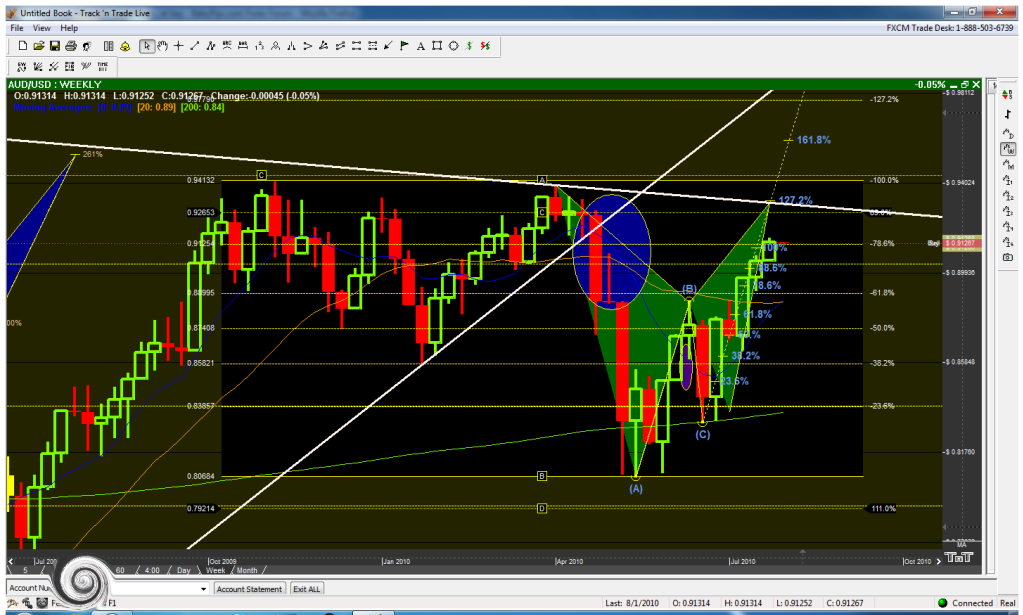
Lets magnify the current area or price and see where exactly it should go. Since the break price has not even come close to testing the support line which held price up from the beginning of 2009 to mid 2010 and as we all know from the basics, price will more then likely attempt to test this point. As you can see from the Green Gartley I have illustrated, there is decent convergence with the .886 of XA and 127% CD. In addition to this convergence, the high to high of the ascending triangle crosses with the convergence adding even more strength and possibly giving us a triple top on the weekly. A respect of the target area would also give “fuel” to the Bigger pattern mentioned previously (Blue) and to the huge ascending triangle (whose top would be tested as well). All in all, I highly discourage a sell at the current zone unless a significant move and close to the bearish side develops on the weekly. In conclusion, be very careful around this pair and just because we shouldn’t counter trade the move up now on the weekly doesn’t mean we cant take advantage of the buy patterns which form on the lower time frames until it reaches the areas mentioned above (Price .93 to .934).
Great insight as always TMB, really appreciate it. A couple of questions though;
-
On my charts the weekly blue pattern you showed (with the 2.61 convergence) doesn’t have any convergence with the 0.886 (200 pips). On my charts the 2.61 convergence is nearly halfway between 0.886 and 1.000, showing no convergence. Charting software error?
-
On your weekly chart I can see a %100CD in very close proximity to 0.382 XA - great convergence, much better than the 2.61. Yet the price had absolutely no respect for it and broke right through. Doesn’t this show that in this pair and in this timeframe, those kind of harmonic patterns don’t work well? If that great convergence didn’t work, should we really be assuming that other patterns with much worse convergence can work?
-
I couldn’t grasp the concept you were talking about when you talked about retests. There is convergence at 0.886 and 2.16 (there isn’t any on mine but I’ll assume my charting software is wrong), and it looks like the price respected that pattern and went down by more than 1000 pips when it hit it. Hasn’t this pattern “worked out” and played itself out, then? What is the exact reason you think the pattern is going to go up and retest this point?
1.) Good observation, yes the difference is that of 200 pips. Yet, price respected the .886 as soon as it reached it indicating that the pattern is valid, the move downwards to the .382 of AD is proof of this. The fact that it took nearly 3 months to break the flag and continue its move to that .382 is because of what you pointed out, the convergence literally “Blows” but price has reached such an extreme in a relatively short time that it plummeted as soon as it reached the level. Personally, I wouldn’t have traded that level because of what you pointed out. But the sole fact that it did respected and continued to after each retest indicates that I should probably consider it if the opportunity arises again as it seems it would with a respectable pattern.
2.) Correct, at first it does seem as if trading this time frame would be a waste of time and because of this I have forced my self not to trade the AUD/USD long-term around these levels. On the other hand, It does show me that when the AUD/USD breaks the .236-.618 levels on the bullish side, I should take advantage and find bullish patterns towards the upcoming levels on the lower time frames. In addition the fact that the .886 of XA was respected with such force (Blue pattern second image) indicates to me that if I ever where to trade the AUD/USD in the higher time frames, I should wait for it to reach the extreme fib (.707 - .886) points and the extensions (1.272 - 2.618).
3.) As I had stated in the analysis, Price did not only bounce from the .886 extreme of XA but it had also broken an ascending triangle with an apex of 3300 pips (Placing it around the low made in October 25 2008 and around 200 pips before reaching a perfect AB=CD [If the current high isn’t broken]). Note that every time price has tried to reach the area of the initial bounce, it has fallen drastically (clearly seen on the monthly chart).
As for my exact reason for it reaching this point again, I believe it is clearly stated within my analysis. The final Image clearly shows a recent pattern (Green Gartley) forming around the area and as I have said in the past Not only does a convergence point act as a “magnet” towards price but the break of a fib point also pushes it towards the next support/resistance area (clearly seen in my first example). Also, you ask about my concept of retest… it is not my concept but that of the basics which is clearly taught here in babypips and I strongly suggest that you go back and re-learn this concept if you have not grasped it for it is something that you must know no matter what trading method you are using.
*Note A pattern is still considered valid until D is broken (Refer to Gartley/Butterfly patterns in the “Trade What You See…” book).
Thanks for taking the time to answer TMB. Not to look like I am pretending to know more than you are (I am a newbie, just trying to understand things), but I can’t see the green pattern you pointed out on your weekly chart. It is the same as the daily pattern we talked about earlier, and the convergence is at 1.00AB. Your version of the pattern has a D at 1.27AB but to me it has no convergence at all, as seen in your chart, it’s right in the middle between 0.886 and 1.000 of XA.
So this leads me to think that the green shaded area is not actually a normal Butterfly pattern, but rather one where you found convergence between an 1.27AB=CD pattern and a down trendline. Am I correct?
It’s not a butterfly pattern, it is a Gartley pattern using the same ABC points you used for your AB=CD (Second swing of the daily is the first swing of the weekly and my X is the highest high of the daily. I must sleep now  peace.
Hey guys, looks like I haven’t shared any patterns in some time now. So here are some patterns for you:
Note: Never mind the entry and SL points. I am closely monitoring the trades myself.
- CHF/JPY 8H: Decent convergence and symmetry but the JPY is on a rally right now so I’m not sure if I want to be trading this.

- EUR/GBP 4H: Good convergence and symmetry, but this pair has failed some patterns this week. I adjusted my X not to the wick but to the base as that fit the chart better.

- CAD/JPY 1H: Good convergence and symmetry.

- AUD/JPY 4H: Two possible patterns. The pic’s a mess but I think you can get it if you look well enough


- EUR/CHF 1H: The symmetry isn’t great, neither is the convergence, but there is a .786 Fib from a higher extreme (the .618 of this particular Fib forced a 200 pip downward move earlier with extreme precision) so it can be used as a confirmation.

Many thanks TMB + Annihilator for your analysis/comments! Have only just skimmed the surface so no replies yet…
Just wanted to put a quick post on a current trade - another cross GBPNZD 4 hour. If it pushes up to 2.1800s, I’ll scale in again. Not all brokers may have this pair, and the spread may be sizable, but RRR is phenomenal at 1:8 and positive swaps. Nice confluences as well to scale out on.
Stopped out on remainder of AUDNZD earlier as well.

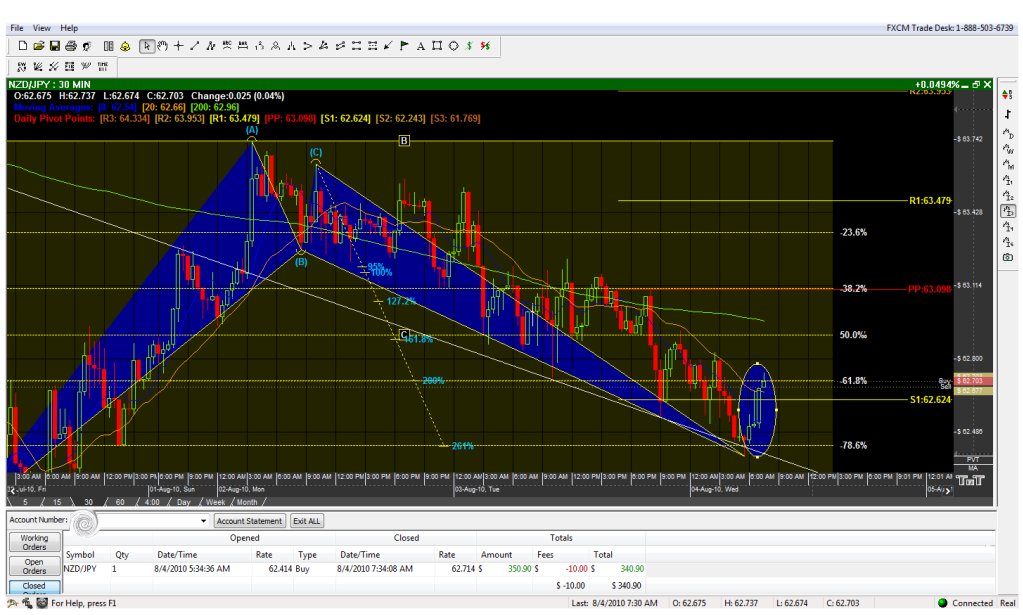
Here we have a Bullish Gartley that has formed at the Extreme of CD. Where the .786 of XA converges with the 261% of CD (Blue Gartley). The white trend line is the most recent low to low of the pair and indicates additional convergence to the zone. Also, the green circles on the chart are previous D points that had developed and completed within the pair ranging between a 25-50 pip move for each instance. This in effect indicates not only that the fib points are being respected within the pair but that their is also a decent amount of buyers and sellers in the market.
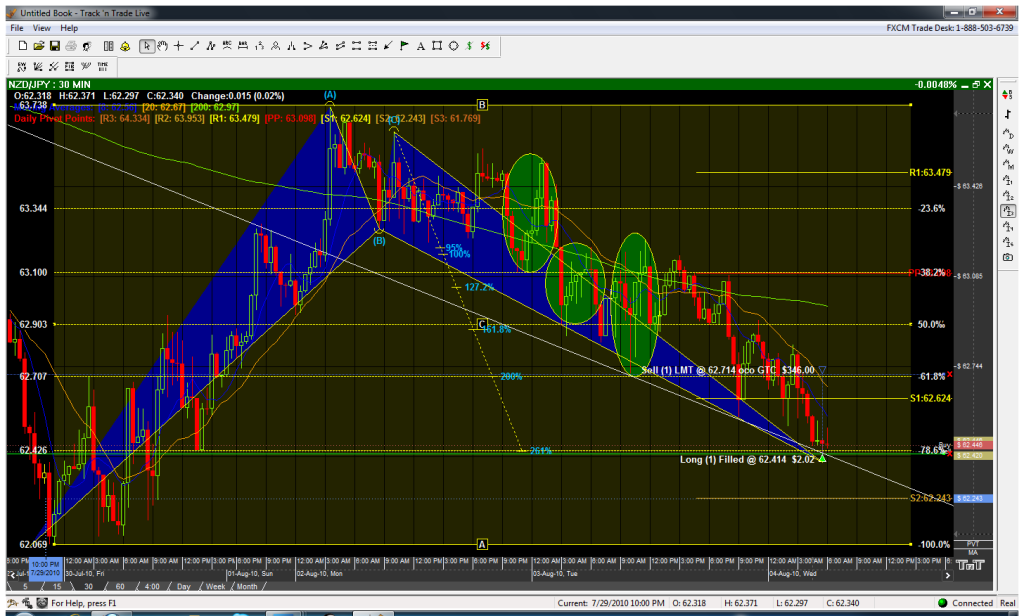
Our target is 30 pips which is 15 pips before reaching the .382 of AD
Great pattern TMB and looks like it’s working out. Was this the only “legit” way of determining the points? For example B and C, could you have chosen a “later” and “lower” B?
If the 261% of CD breaks then I can move on to the next swing. If that point is not broken then any other swing would be considered illegitimate, with the exception of using them for further confirmation (additional fib levels crossing in the same zone from different swings, X’s, etc… add to the convergence area and during times of multiple convergence help you determine what convergence point is the best to use).
Great! I think it just hit 30 pips and retraced… I entered late and I now sit at +5 pips, down from around 15. My SL is at breakeven, though.
Never chase price ;), remember that the previous D’s on the pattern only retraced around 25-50 pips. I would have posted the pattern earlier for you to grab it but HMoneyBags found that one for us :rolleyes:, and I was analyzing it as it triggered.
Hey TMB I know you are done for the day but could you please answer this for me…
This chart is AUDJPY 30min (never mind the red lines). Now, according to this chart, are the only valid B and C points the ones I marked as 1 and 2? Because it has to be the first swing? In a regular Gartley (or Butterfly) we couldn’t have chosen 3 and 4 as our B and C points?
It looks like I have been asking this for too long  But please!

Bellow is how the chart should look after using the correct swing and like I stated previously your first swing must be used unless the 261% of that CD is broken. Anyways here we have two great bullish Gartley patterns. The first one completed at the .618 of XA converging with 200% CD. The second pattern is at the extreme of 261% CD converging with .786 of XA. This is indeed a beautiful pattern, not only is it the extreme of CD and XA but it is also converging with a daily pivot point adding to the force of the pattern. As a result it bounces with force and creates a swing for an up coming bearish Gartley… As you can see, this pair respects the .618 and the .786 fib levels. You should take note of this and make sure to trade around those areas and not be fooled by earlier convergence that may land around the .382 and the .500.
