Have great weekends everyone! 
 :o :eek:
Hey all, I would like every one who is following this thread to know that I will be leaving right now to a “retreat” to relax for the weekend and will have no cellphone or computer insight until the open of London Monday morning est. Those of you active on the thread please help me by answering questions for those that need help. In addition feel free to leave any comments, questions, etc… I will go over the thread upon my return.
Thank you. 
Thanks nlr, very interesting article. Thanks very much for sharing!
Bank
Hi All,
Doing my usual end of week look back and am seeing a possible pretty butterfly setup on GBP/USD 15M.

fx360.com/images/chartPatterns/gartley-bullish/chart1.jpg
the numbers 61.8% from A-C are consistent with all the examples shown on that site, as is 61.8% or 78.6% from AD and from BD 161.8 or 127.2 seem to be the only variations. what are these numbers and how can I measure them. I dont understand how to do this with the fib tools or am I totally off track. If anyone can help me Id appreciate it 
Hi Kia,
Firstly you need ensure that you have the fib levels as Tmoney outlined on page 7 of this thread, was trying to link it but not getting it. Once you have that together we proceed as follows, you can also go back through the earlier posts as Tmoney has some videos(1,2) on this.
[ul]
[li]Find an extreme high or low. This will be called X.
[/li][li]Where the first retracement is made from that point, label as A
[/li][li]Fib from X to A
[/li][li]Where the first retracement is made from point A, label as B
[/li][li]Fib from B to A
[/li][li]Where the market bounces between AB, label as C
[/li][li]Click and drag BA fib until 0% is aligned with C
[/li][li]Look for convergences at 127.2%, 161.8% and or 200%
[/li][li]These will be the probable turning points
[/li][/ul]
Hope this helps. Please remember also to look at Tmoney’s Videos.
Bank
From what I’ve been studying lately, I’d be a bit concerned that this butterfly might be invalidated because of the lack of symmetry. That super-long congestion area after forming the C might have done it.
Hey Lavaman,
I never quiet got that business of symmetry. Can you please post an example and explain?
Thanks!
Bank
Hey BDP,
It feels funny trying to answer this, since TMB was trying to explain symmetry to me early in the thread (I don’t remember which post, but you should be able to track it down). In Trade What You SEE it is further explained, but without my book or notes I’ll take a stab at it and TMB can correct me if he needs to.
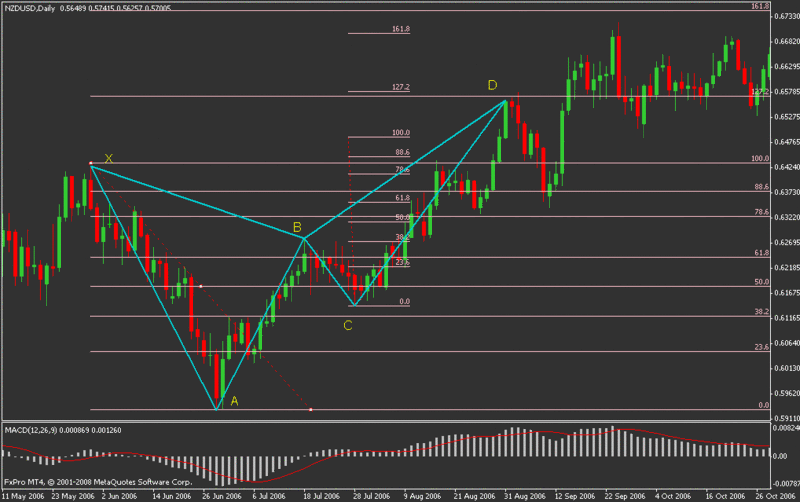
One major aspect of symmetry is the amount of time it takes to form the legs of the formation. For example, if the AB leg is 10 candles and the CD leg is also 10 candles, that’s great, especially if it’s an AB=CD formation. If the CD leg is longer than the AB (say, to a 1.272 or 1.618 extension of the AB), then it should probably take a little more time to complete. In my example the AB is about 15 candles and the CD is about 24, but the CD is longer than the AB so it should be expected to take a little longer. The slope of the lines is at least somewhat close, but this is by no means a perfect example. The way I see it, the strong bullish candles towards the end of the formation are a good signal that the CD leg might make it to the 1.272 extension of the XA leg.
Well, I’m new to this too, so try to get a second opinion on what I say. Basically though, I think slope, time and how “aesthetically-pleasing” the formation is are key. To put it simply, if it looks more like a butterfly you’d see in nature than a mutant butterfly with a freakishly large wing (no offense to your formation :D), it’s probably a better pattern to trade.
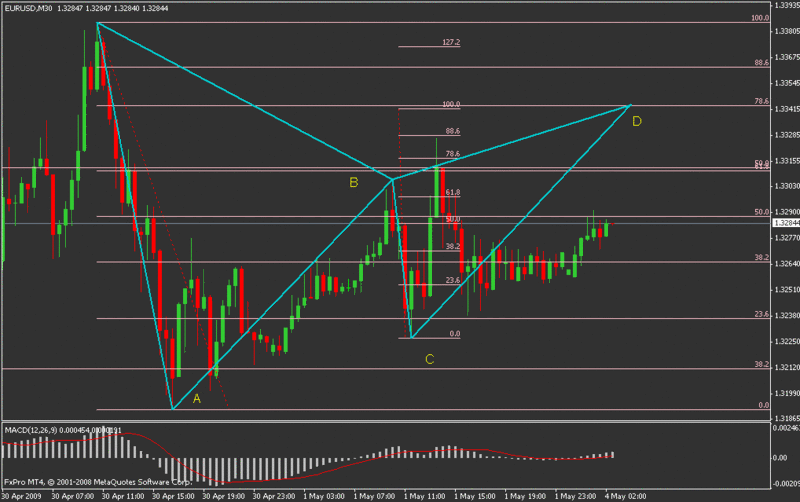
A possible gartley sell forming on the EUR/USD 30 minute charts. I’ll probably only take this trade if price can rally up to the D in the next 4 or 5 hours. After that I won’t be digging the symmetry enough to go for it. As it stands, if it can get there in the next couple hours it will also be a nice AB=CD pattern, as the D hits the 100% fib level of the AB.

First off - TMB this is an a amazing thread. It looks as though you’ve got a great strategy working here. I have been occasionally trading this pattern, but the guidance provided here offers an awesome opportunity to harness the potential.
I have a couple of quick questions. On a technical note, how do you add additional fib levels in Marketscope 2.0 (i.e. .886, which is not an option in the selection window)?
Second, as I hear over and over, trading is not an exact science, so what is the max spread between fibs that you will still consider convergence?
I welcome anyone to lend a hand!
Thanks
Hi grs,
Welcome to the thread. Looking forward to your sharing your experiences with it.
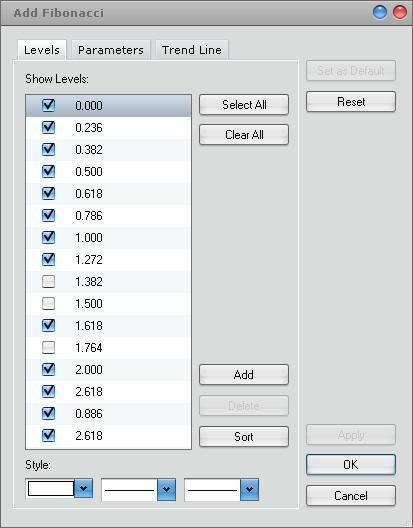
I use marketscope too, and reusing tmb’s pic, if the fib level isn’t on your list as per below, then just use the Add button and add it…lol.
Also, I believe TMB said something about a 5pip spread buffer between fib levels…

To Add custom levels, draw a Fib to get the window open. Should automatically display the levels, simply click “Add” which is to the right above “Delete” & “Sort”, it will add a 1.000 level to the list, then just and highlight edit that to whatever you need. You can keep clicking add until you have enough, then just click and edit them one by one from there. This is a real simple process, Market Scope makes it a little annoying IMO, could be streamlined, but then again the program is far from perfect.
Ahh I see. I didn’t realize you could manually input custom levels.
Thanks!
Hello everyone,
Here is a Gartley on EUR/USD 5 minute chart
let me know what you think people!
Cheers
Hey Ogna,
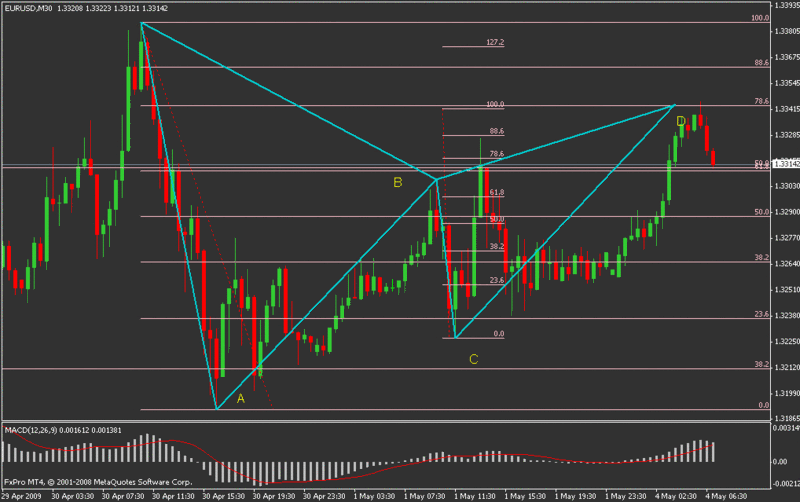
That’s almost the same gartley pattern I drew up a few posts back. The only difference is we used a different BC leg. It didn’t change the outcome too much. Anyway, I was triggered into the short trade at 1.3338 (I shaded it a few pips in case it didn’t make it to my D, which was around 1.3342). It’s having trouble going higher, so that might be a good sign…
Thanks for the response,
I looked at your chart and it is very similar. This makes me think which B leg is correct? Maybe this is a question for TmB:D
We shall see how it plays out, good luck hehe
Cheers
*Edit: How do you post full size charts? ^.^
I have a free account with photobucket. I just upload a picture on that site and it gives me a url link for the picture. Then, when I post a picture on BP, I click the “insert image” icon and paste the image url in the box that pops up.
Hope that helps!
The only concern I have about takin that trade now is the time…according to TMB, fakeouts tend to happen more around this (9pm-11pm est). I see price just kinda consolidating around there when it should be going down by now…


