maestroshin119, thanks for your input. i almost missed it! thanks
Hi guys,
after evaluating a lot of reading material i have begun to look for gartley and butterfly patterns. I am a newbie so am looking for as much honest criticism as possible.
heres a worded explanation of the attached pattern i drew…
this is a current snapshot of the Eur/USD m15. since the BC leg retraced just under .500 of the XA leg, i assume a butterfly pattern will form. i also see convergence at 1.618 of AD with the 1.272 of XA where i have placed an entry (the dashed white line on the chart, buy entry). maybe my entry is placed +5pips to where most would place the trade but since this is my first pattern i want to make sure i get an entry. still demo trading!
further confidence in this pattern comes from the ‘D’ point being at the 2nd profit target (1.272 of XA) of a previous gartley pattern i drew…
i hope i’m doing it right… any if any of the experienced traders could advise i’d be much obliged!
Thanks

I am not going to comment too much on the pattern you drew seeing as how it follows all the rules set forth by TMB and as anybody can see, it was a success. Good job on the find!
What I am going to say is to look for other indicators that a pattern is going to form when you are first starting out or even in daily use for the future. The main thing that I like to use, stemming from some of TMB’s suggestions, is support/resistance lines. If you have a pretty good convergence that is then supported by a line of support or resistance, that is all the more reason to trade that pattern. The pattern you posted above had a line of support meeting at the “D” point which was connected by the low on Aug 12th at 08:00AM EST and Aug 13th at 10:00AM EST. This line of support, coupled with the convergence, would have given me more reason to stand behind the pattern that was forming.
Hopefully this helps!
racerdude777
hey every1, i was wondering if anybody could comment of the following snapshot just so i know if i am on the right track with these patterns…?
the yellow gartley has an exact convergence of 1.272 of the CD with 1.000 of XA. however, as the CD leg is going south i noticed another possible pattern, a gartley buy. the purple pattern outlined again has convergence at the 1.618 of CD with the .886 of XA.
am i right in recognising a possible set up or am i just forcing it…?!
thanks in advance!

thanks for the response racerdude… i was thinking that once the pattern did complete (not visable in the chart i posted) the pattern lost symmetry, and maybe it hit TP by fluke. which kinda took out the satisfaction of spotting a pattern?!
I had noticed this one and had been monitoring it as well… It is up in the air right now as to which way it goes. If you take a step back and look at the EUR/USD daily, it has retraced 38.2% of the most recent upswing from 1.18757 so this may be a point of resistance which will see the pair climb to the “D” point you have shown. There is some similarity between the EUR/USD and the AUD/USD as you can take a look at that pair and draw the same sort of Gartley pattern so there is evidence that should one pair ascend to these points, others may too. And further, if you do look, should the AUD/USD reach the “D” point and reverse, it will be creating a nice head & shoulders pattern on the 4-hour. Same thing with the EUR/USD on the larger TF’s. Keep your eyes open, I have my entry level set at the “D” at ~1.2905 and am waiting PATIENTLY for it to hit lol. If anybody else has anything to comment on or add, please do!
But hey, its all if’s at this point
How is this looking? I’m about to start reading “Trade what you see” tomorrow.
img641.imageshack.us/img641/7839/potentialgartly.png
(note I [B]did [/B]spot this one around 1.2860ish - not afterwards)
Update: I AM FLAT, however I could be up 20 pips right now.
img580.imageshack.us/img580/7839/potentialgartly.png
I always doubt myself, I need to read some psychology books or something.
Hit exactly 30 pips then reversed on some positive euro news.
img153.imageshack.us/img153/2543/potentialgartly2.png
Final version. Could have easily made 30 pips. Reversed on fundamental rumors, but with a non greedy take profit, would have made 30 pips at 1.2832.
So this was a valid gartley even though it did not hit a specific Fibonacci level, it did reverse after the final leg in a bullish fashion.
am I right? anyone have any comments?
CD’s length at least has to equal AB’s length. That is not a Gartley.
The only reason it reversed was because of rumors of a larger then expected fundamental report that is about to be released. If that would not have came out it would have continued to drop. Does that matter, even though it went exactly the way I saw it? 30+ pips.
You say it didn’t respect a specific Fibonacci level, and your points were not Gartley points at all. That trade didn’t have anything to do with Gartley trading, it was a fundamental trade.
How u doin racerdude… it seems patience paid off and your order was executed and hit TP. although your analysis was a lot more thorough than mine i did set my short at 1.20906… im just trying to understand the rules of the patterns as posted by TMB. i guess when i am comfortable with that, i can then analyse the bigger picture and look out for reasons as to why and how the market may achieve the D’s the theory suggests.
But in the time being, please do carry on posting your thoughts on outside influences that may help or negate potential D’s. Im still a newbie to forex so i find it very helpful getting into the minds of other traders.
cheers
Hey all!
I’ve been reading this thread and others like it for a couple weeks now and really like working out these patterns. My problem seems to be finding them. Does anyone have any tips on locating a good ‘X’ to start from?
So last night I sat and looked at charts until I found some patterns. Some failed miserably and I see now some of my mistakes but I have two I wanted to post up here and get some feedback on.
I apologize in advance, the EUR/JPY isnt labeled but hopefully you can tell what I was looking at as far as XABCD points go.
I also have trouble finding D, do you just look for the best convergence over 100% of XA? I know I have read this at least 3 times in here and I have the rules printed off but I think I’m missing something so any extra info would be much appreciated.
Thanks! 


Sup all back from vaccation!
Anyway i use an approch where i try to also find convergence between the fib convergence and pivot points, daily and weekly. I will show one picture bellow:
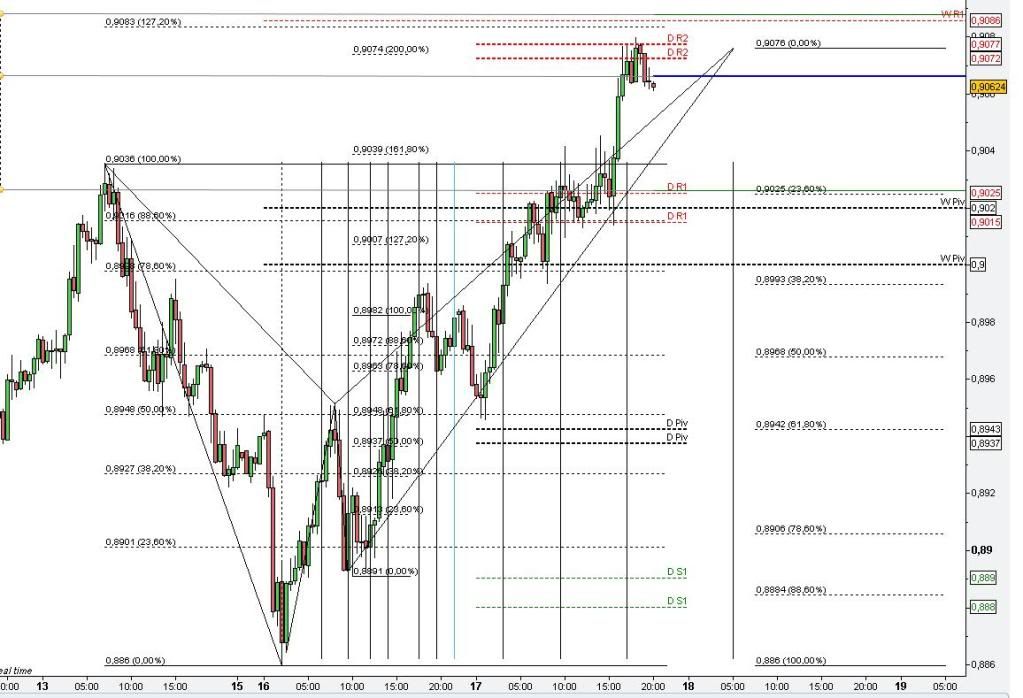
I rather want the convergence of the fibs and the pivot to be spot on, but here we have 2 dailys and a weekly plus the fib convergence close by. But i only took half the risk on this one and waited abit for the candles to form. But that is how i choose my entrys, it have to convegence with pivots 
For choosing the X point i use and approch with Fib time zones, posted about it a while back if you want to read
//Chris
the attachment shows a Gartley on the 4 Hour TF that coincides with the
turning point you show on the Butterfly and the Pivot Points. May not be the strongest Gartley on the 4 Hour given the convergence of 100% of AB with 61.8% of XA but given this other info, makes me feel better about getting in this trade even if I risked half of the normal

Yes we will see how this plays out  Same here only risked half my normal
//Chris
Hello!
I’m new member on this forum. I learn to trade Gartley models, will be very glad, if you will be help me. Later, I’ll post some analysis.
I dont use any indicators for search patterns. I Search patterns by my hands, head and eyes
Good luck to all us
Sorry for my English, Thanks!