Wow, I never noticed that! Thanks.
My stop-loss placement varies depending on the set-up, but on average it’s around 20 pips. My profit target is the 0.382 retracement level of AD at a minimum.
Let’s put it this way: I enter a trade when I think I know how price should react at a certain level. If price then proceeds to go against me, then it’s not doing what I thought it would (should?) do, so why stay in it any longer than I need to. Sure, there have been many trades that stopped me out only to turn around immediately and go in the direction I had anticipated. Sometimes I can manage to jump back into the trade, and sometimes I just have to let it go.
The main reason for entering any trade is because you anticipate the price action to behave in a certain manner at a defined level. As soon as you notice price action not behaving in the manner you anticipated, then get out of the trade. Don’t stay in it hoping or thinking price will turn around. It may or it may not. But get out of the trade. If most or all of your trades go against you and call for you to exit the trade, or you get stopped out, then what you have to question is your entry points, as well as the reasons for your entry.
thanks for the reply . Im going to stick with this sytem and hopefully ill get better at it. TMB says his way of trading these patterns gives him around 70 - 90 % success rate. I dont want to sound like im giving up its just that this sounds a bit too high.
Hey Dan89
I’ve been trading for years, and man have I tested system after system…after system.
Not that this harmonic system will suit everyone, but you don’t stand a chance of finding a system that does suit you unless you give every system you try a decent chance to prove itself one way or the other.
Personally I think 70 - 90ish% is very obtainable with this system, and I take my hat off to TMB for being able to achieve this. However, the trick is to maintain that sort of level. Anyone might get lucky and have a good month or two, but time soon weeds out the true winners from the losers.
Maybe you could post a chart or two now and again to show us what you’re looking at and what your thinking is behind it. That way you will probably get a little feedback from other traders. If you’re like me, any comment or opinion directed at you is worthy of noting. You don’t have to take on board what is being said, and you certainly shouldn’t take any comments or opinions to heart (and that goes for what I have to say also  ). But what you might get out of it is a broader perspective and a little more awareness of trading situations and set-ups.
As long as I’m available, I’m always willing to help. Just bare in mind that I haven’t proved myself yet with this system, but I’m sure that will change in time
thanks for the guidance and recommendations man. I think your right, i should start posting up my charts/trades and reasons for taking them. Hopefully i will get better with other members opinions and critisism. Thanks man
Here is one that just missed by a few pips (if i drew it correct). Would of given us around 60 pips easily

Hey Dan89,
Nothing wrong with that picture imho. I was watching the same set-up (my first chart). However price didn’t touch my fib levels so it’s one of those that got away from me. While placing a trade entry just below the fib levels might give you a better chance of catching the trade, the downside is it would also require a bigger stop-loss level. Too many fish in the sea for me to be upping my stop-loss that much.
But price didn’t reverse drastically and is now retesting that zone. There’s a possibility the zone could hold again, in which case the reversal this time should be stronger. If the zone doesn’t hold this time, then the first reaction was just a minor reaction before price blows right through that area.
So if the zone holds again, you can afford to be a little late with entering the trade on the anticipation of a deeper reaction second time around, while also keeping your stop-loss to a more tolerable amount.
On the other hand, if price blows right through, then on this chart alone I can’t decide with any great conviction where the potential D might be.
So I took a look at the NZD/USD 4 hour chart (my second chart). That pair seem to be playing the same game, and what’s more there are two areas I’d be happy to go short at. So if the AUS/USD does blow through, keep an eye on the NZD, as when this one turns around, chances are the AUS aint to far behind it.


Yeah im gonna keep my eye on AUD and see what happens. Clear support/resistance zone on this one.

BTW where abouts are you located, you seem to be on this thread around the same times as me lol … im in London
Nice call on that support/resistance line.
I’m in Co. Wexford, Ireland.
I’m doing a lot of study on this new system, so I’m at my screens from around 7am to 10 - 11pm most days. (It’ll all be worth it in the end )
What part of London are you in? I lived in Kilburn for a year or so before moving to Woodstock (Oxfordshire) where I lived for ten years. I’m back home now though
Cool, im actually in greater london, technically surrey. I was in Ireland a couple of months ago - Dublin. Went to visit a few old friends who moved there a while ago
Yeah all that screen time is gonna pay off, keep at it man. Cant imagine how much screen time TMB has had lol
Yep, there’s nothing like a little dedication. I’m sure TMB has served his time so to speak If something is worth having, then you’ve got to be prepared to put in the effort. I doubt there is any consistently profitable trader out there that has had success fall into his/her lap.
For the last number of years I’ve spent an awful lot of time in front of my screens, and if nothing else, it’s taught me the two golden rules of trading:
- Preservation of capital.
- Never forget rule number one
Im not sure if you have read this post by TMB that i made into a pdf … check it out there are some things that i forgot. Its his trading checklist and trading times. Not sure what the exact GMT - London times are though.
Trading Checklist.pdf (10.1 KB)
Trading Times.pdf (20.3 KB)
One thing he mentiones is
‘If your BC leg is a .382 retracement or gap, then CD must be: 127% - 261%’
Does this mean an exact 382 retracement ?
Quick question for anyone using FXCM’s TS II. Does anyone know how to change the chart from bid to ask, or vice versa? I know how to change the price overlay, but all that does is change the current price displayed, it does not change the closed candles for me. Thanks.
Hey Pete,
Take a look at the image I’ve attached. The last two icons on the right are the two icons that will change the chart to a ‘bid’ or ‘ask’ chart.


Edit: sos just noticed pleaidian beat me to it
Yep, I read the post.
As we are in daylight saving time, just add 5 hours to the times quoted by TMB. I posted a question to him earlier today inquiring about the current validity of those times, but I haven’t had a reply yet. I do keep a note of them though.
As for the checklist, it’s a good idea to use it until you are totally familiar with the strategy. That is unless you wish to create your own strategy. Regardless, there are some good points in there to always keep in mind, and some questions that you should always ask yourself before entering a trade.
Regarding the BC retracement: It’s once in a blue moon price might turn exactly to the pip on the fib level, so I think a little discretion would be tolerated.
Lol. I’m on the ball tonight
Wont be for much longer though. It’s 01:00 and I wanna be up for London open.
Wow, that was simple. Thanks.
Guys, I think this is an important distinction, and if you want to trade this method well I suggest you become an expert in the ABCD pattern. It is an excellent pattern in it’s own right, made even more powerful when it converges with an XA fib retracement. It is not the most galmorous pattern, and I think it gets overlooked for that reason.
There seems to be some confusion on this thread stemming from the labelling of these patterns as “garltey” or “butterfly”, as many of the patterns do not conform to the accepted fib proportions, but that does not make this method any less valid. I think TMB is using these terms as blanket labels for the structures or “advanced ABCD patterns.”
One area you might want to look at with the abcd patterns is the BC retracement, as it may give you a clue as to the possbible extension of the CD leg. As TMB states on his instructional videos, BC retracement of less than .382 should not be traded as gartleys, as the CD leg will most likely be well extended. As a general rule, the shallower the BC retracemement (there are prescirbed reciprical ratios), the further the CD extension in relation to AB. There is a lot of information in the BC retracement, and it may assist you in choosing the correct D when faced with multiple XA convergences. Projecting the BC retracemtent will also give you another confirming factor to measuring the AB and applying to C.
So, with that in mind, here are a couple of ABCD patterns I am looking at.
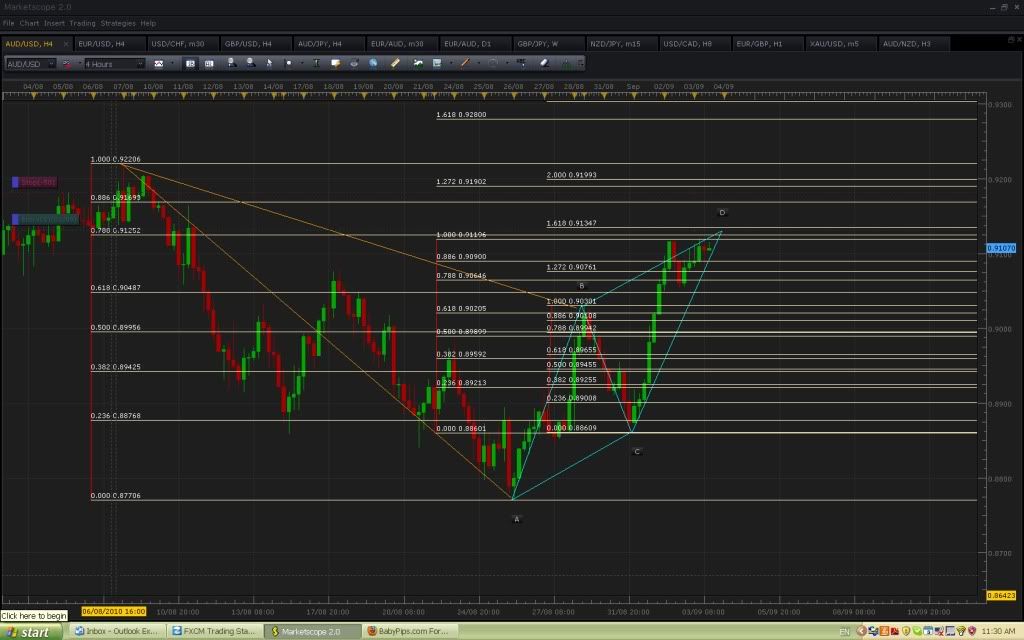
Firts, on the au h4,
AB=CD= .91196 (exactly where it pulled up)
.788XA = .91252
BC retraces .618 of AB so we should expect 1.618 projection of BC = .91347
So while there are no certainties, there is an increased probability of price finding resistance in this .91196 - .91347 area. And if price does break these recent highs, there is a chance it will be a false break and can be faded.
This is just an abcd, with the XA fib as an additional level of confirmation.
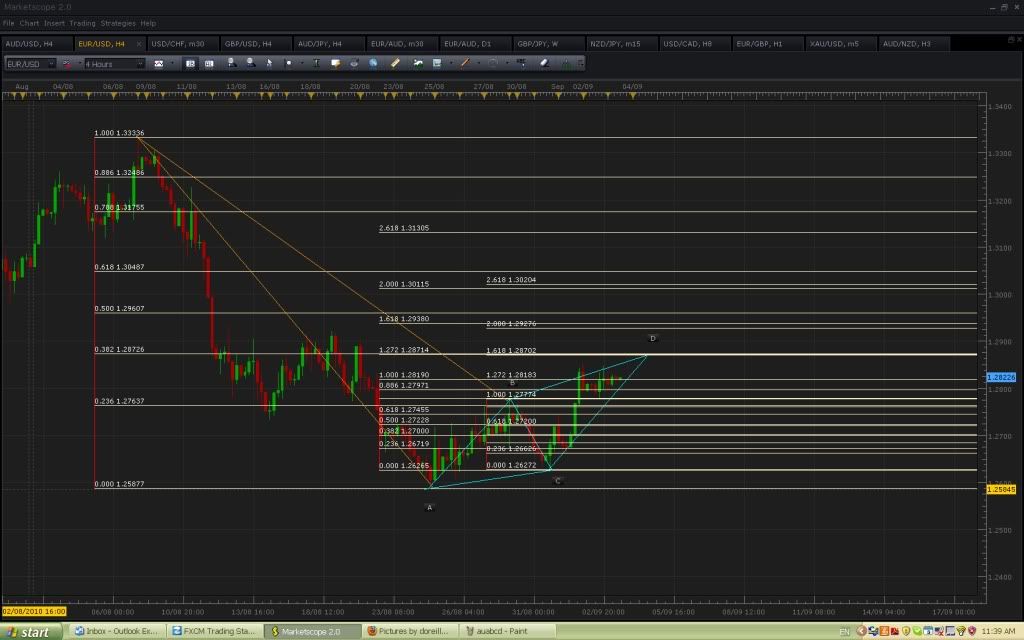
Here is another example on the eu h4. I am more cautions on this one as BC retraces .788 AB and therefore we should expect 1.272 BC projection (where there was convergence), rather than 1.618 BC projection as on the given diagram.
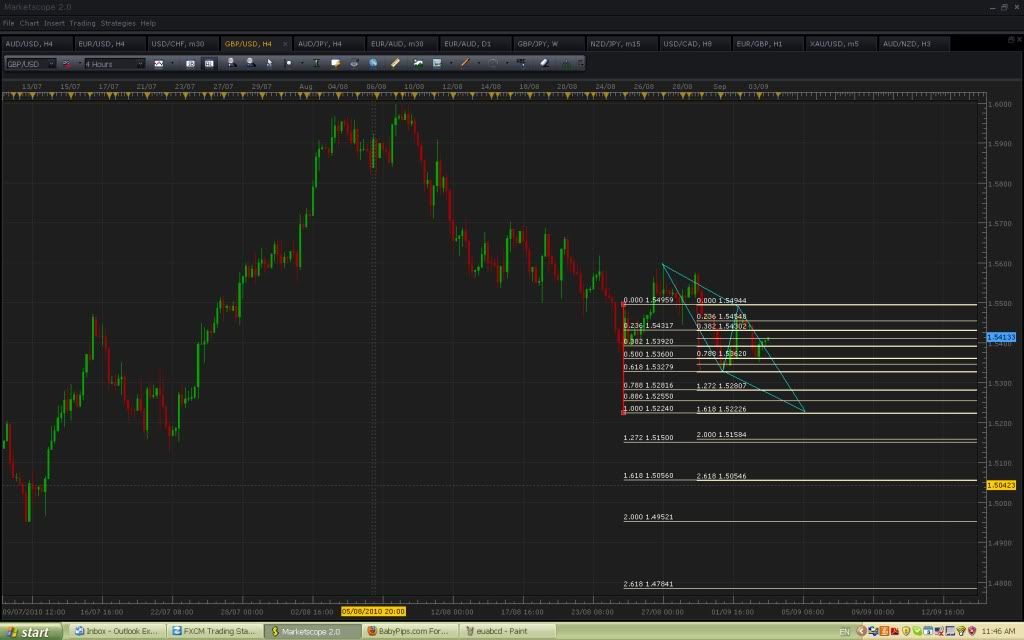
And finally, here is a possible abcd forming on the gu, which migh suggest the trade is still short and provide a profit objective or area to go long.
No doubt these will all fail, but the point I am trying to make is give the abcd some respect, and view this thread as more of an advanced abcd thread in order to stop some of the confusion.
Couple your pattern analysis with trendlines, pivots, your favourite indicator etc, and if executed with discipline and selectivity I think you will improve your odds.
All the best, please correct me if I am wrong.
Modo.
Hey all, I’ve been reading this thread for quite some time and am going to start contributing more. After reading “Trade What You See” and hundreds of forum pages I can easily see these patterns when others post theirs but I am really struggling on my own when A) finding the correct points and B) determining which convergence would be best for a potential D.
So I’m going to start putting myself out there for criticism because I wont learn otherwise 
I’m looking at the GBP/USD 60M
The B point retraces back to .382 of XA, so I’m thinking butterfly here?
On that note I see a decent convergence of a potential D at the .768 of XA with the 1.618 of CD, potentially.
Any thoughts/ critiques would be greatly appreciated. I’ve been studying these patterns for a while now but feel like I am missing a small part and when I get it this stuff will finally click!
Thanks!
