Guys, I think this is an important distinction, and if you want to trade this method well I suggest you become an expert in the ABCD pattern. It is an excellent pattern in it’s own right, made even more powerful when it converges with an XA fib retracement. It is not the most galmorous pattern, and I think it gets overlooked for that reason.
There seems to be some confusion on this thread stemming from the labelling of these patterns as “garltey” or “butterfly”, as many of the patterns do not conform to the accepted fib proportions, but that does not make this method any less valid. I think TMB is using these terms as blanket labels for the structures or “advanced ABCD patterns.”
One area you might want to look at with the abcd patterns is the BC retracement, as it may give you a clue as to the possbible extension of the CD leg. As TMB states on his instructional videos, BC retracement of less than .382 should not be traded as gartleys, as the CD leg will most likely be well extended. As a general rule, the shallower the BC retracemement (there are prescirbed reciprical ratios), the further the CD extension in relation to AB. There is a lot of information in the BC retracement, and it may assist you in choosing the correct D when faced with multiple XA convergences. Projecting the BC retracemtent will also give you another confirming factor to measuring the AB and applying to C.
So, with that in mind, here are a couple of ABCD patterns I am looking at.
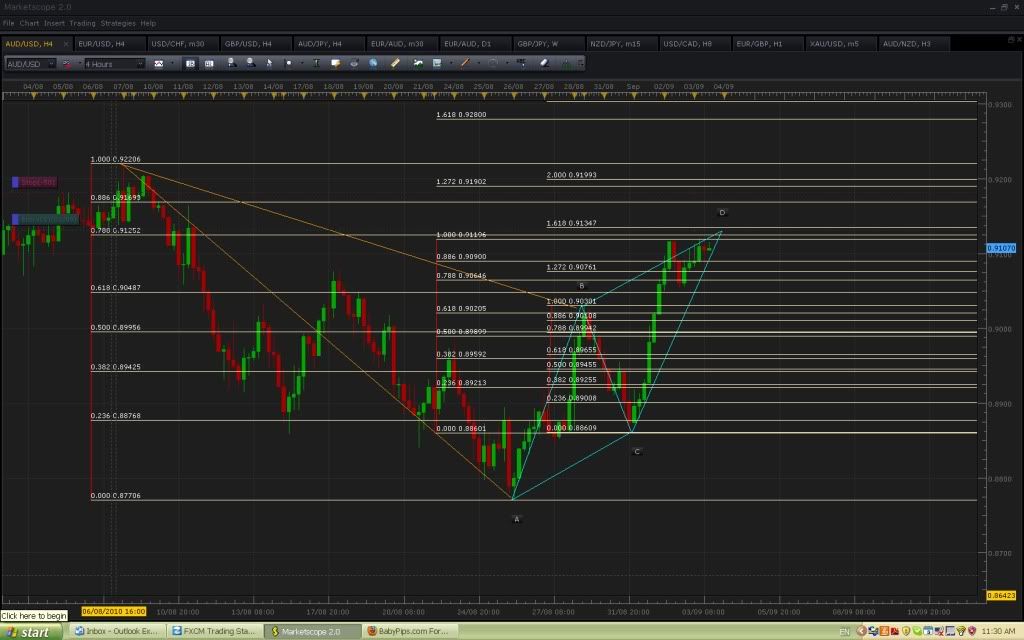
Firts, on the au h4,
AB=CD= .91196 (exactly where it pulled up)
.788XA = .91252
BC retraces .618 of AB so we should expect 1.618 projection of BC = .91347
So while there are no certainties, there is an increased probability of price finding resistance in this .91196 - .91347 area. And if price does break these recent highs, there is a chance it will be a false break and can be faded.
This is just an abcd, with the XA fib as an additional level of confirmation.
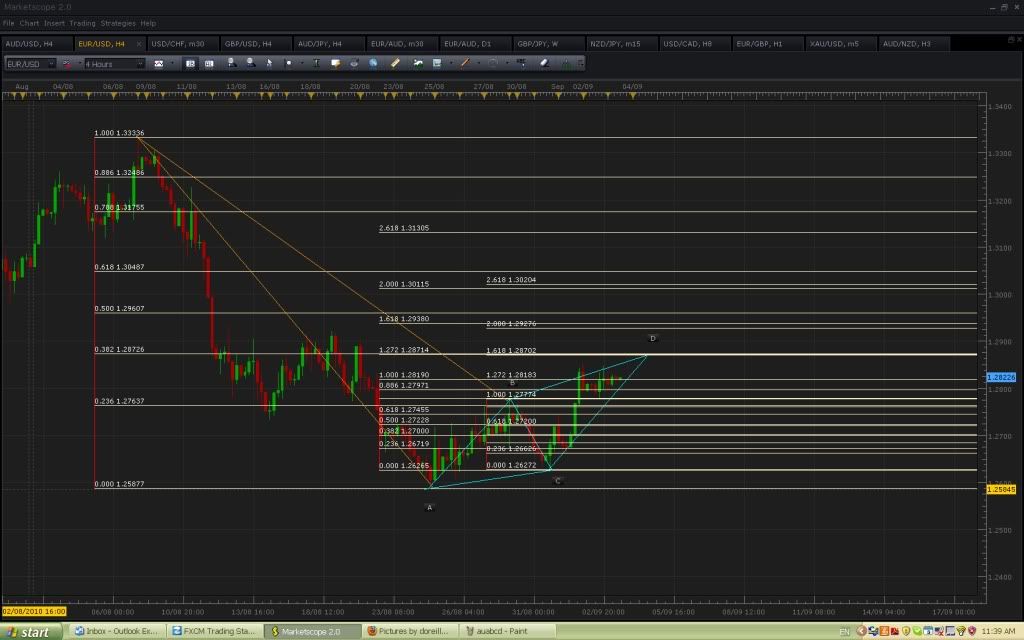
Here is another example on the eu h4. I am more cautions on this one as BC retraces .788 AB and therefore we should expect 1.272 BC projection (where there was convergence), rather than 1.618 BC projection as on the given diagram.
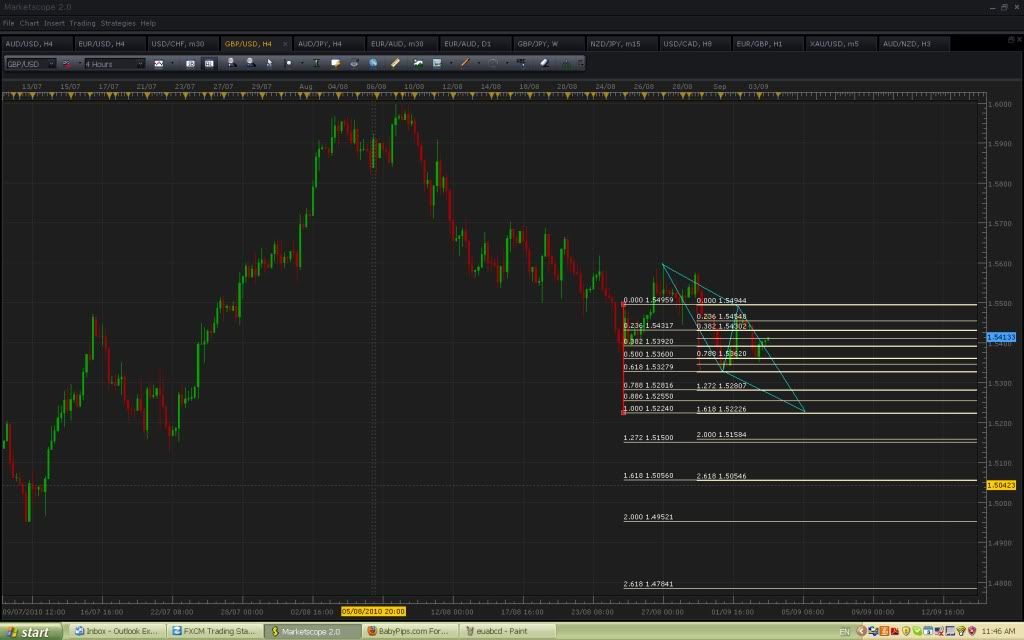
And finally, here is a possible abcd forming on the gu, which migh suggest the trade is still short and provide a profit objective or area to go long.
No doubt these will all fail, but the point I am trying to make is give the abcd some respect, and view this thread as more of an advanced abcd thread in order to stop some of the confusion.
Couple your pattern analysis with trendlines, pivots, your favourite indicator etc, and if executed with discipline and selectivity I think you will improve your odds.
All the best, please correct me if I am wrong.
Modo.


