Glad to see that the trade worked out for you.
On a technical note, the CD leg should at least equal the AB leg, and in this case it didn’t. But hey, it worked
When you measure the AB leg (from B to A), move the fibs across so that the level that was at A is now sitting at the C point. You then have a fib measurement for the projected D point, which should be at least 1000.
On top of what The Pleiadian said… the “D” must always be higher than the “B” and the convergence must be of 100% - 261.8% CD with < 100% XA. As far as the rules of the Gartley pattern are concerned, this trade was luck. This is for Gartley patterns though, butterfly will converge with > 100% XA.
Comparing both of our charts, our broker feeds are a little off (+/- 5 pips) but that’s not uncommon.
Are you choosing the entry at 9215 level for a tighter stop? I can see the 2.24 Fib (30min) runs at 9211 and the prior high on the 4 hour at 9219.
Yes, I rarely plot the CD projections, and I admit it was an afterthought after I posted the chart. In fact, I never did plot them before I stumbled onto TMB’s posts here. It’s made me think about how I’ve been doing things, considering I’ve only started doing this the last few weeks and yet I’ve been trading them successfully the last few months. Hmmm, something to think about… not back to the drawing board by any means…
I definitely give more credence to the XA and BC extensions to form the D point, and this is basically all I’ve used previously along with normal S/R zones, round numbers etc. But yes, I am aware all these harmonic patterns have better probability with an AB=CD pattern (including variations) comprising the AD leg. Thanks for bringing it up, clarity is power.
I’d love to be a part of your room, it’s an idea I was thinking of as well, some kind of ‘real-time’ community! Great minds… many thanks for the invite my friend. Send me a Private Message if you’d like, I’ll be away before London open today until the market open next week…
Price had strong rejection right at my take profit @ 1.2680, spiking down to 1.2681 - missed it by 1 pip. Now 40+ pips away… I will leave my stops at b/e.
Lesson - perhaps I could have had a more conservative TP (by +2/3 pips) considering multiple prior Support rejection hits. Not to worry, it’s a free trade and I’ve already banked some profit.
200% @ 1.2633 of BC is 2 points lower then the a 1400 GMT option expiry @ 1.2635. I dont know what kind of option is in place, but possible protection?
Based on the candles/London opening it may test 161 or even 200% of BC
It’s at the 121 right now, making it a valid AB=CD
Broke through it but not with a gap, so I doubt any stops were placed there. But im going to keep watching price action to see what to do.
Bulls/Bears battling it out whle I watch what to do.
Looks on course to test 161% and possibly 200%, but you never know with the forex market.
If it passes or stalls around 161 ill buy, if it does not and gaps then I will assume it will test 200% which is near an option expiry, then 261% is next I will look at which is near a final option expiry.
(the current 30 minute candle depicts a shaved head bearish candle) but yet no gaps.
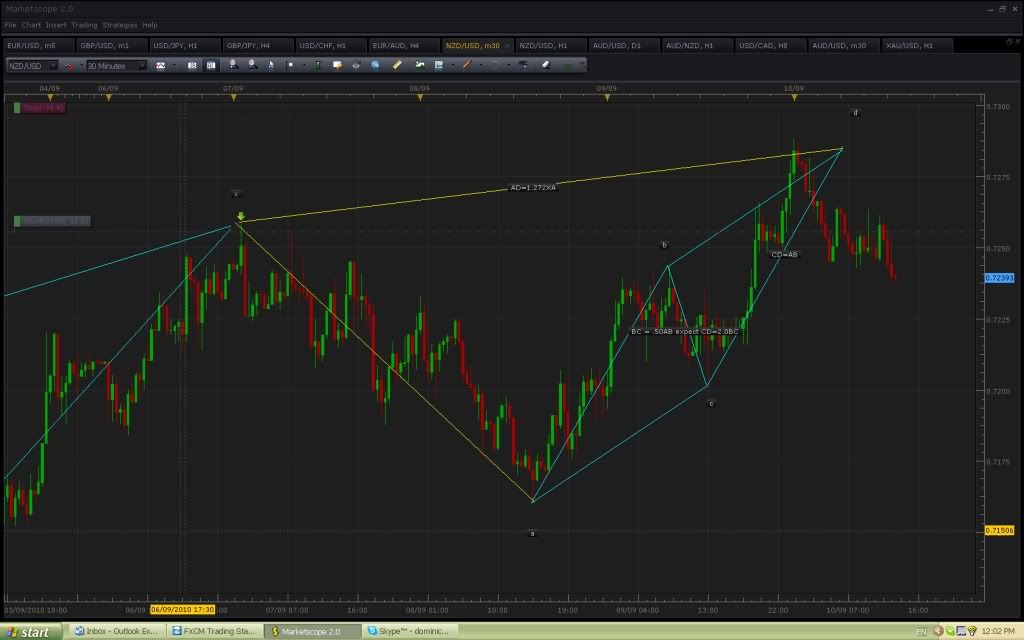
Not sure if it’s the same pattern as I can’t view your chart, but this was a nice ABCD on the nu m30. It was strengthened by the convergence of 1.272XA.
I did not take the trade as I have a small residual short from the previous h4 bearish butterfly.
Oops, I just realised I incorrectly drew this on the ask, but it does not make a great deal of difference on this occasion.
Yes, all the feedback has helped a ton. I think after reading the Trade what you See book and 600 pages of forums, I simply had too much jumbled in my brain…but its starting to come together!
I’m heading out for vacation, see you all when I return…Happy Trading!
Pagjr,
I see what your talking about, but not sure about your D point. Looking at the 127.2 of XA and 100 of CD your getting converjance. Pluss it’s sitting on a Resistance line making it a potential reversal point. Should know in the next minite or so if it breaks and heads to your point or turns. good luck witht he trade.